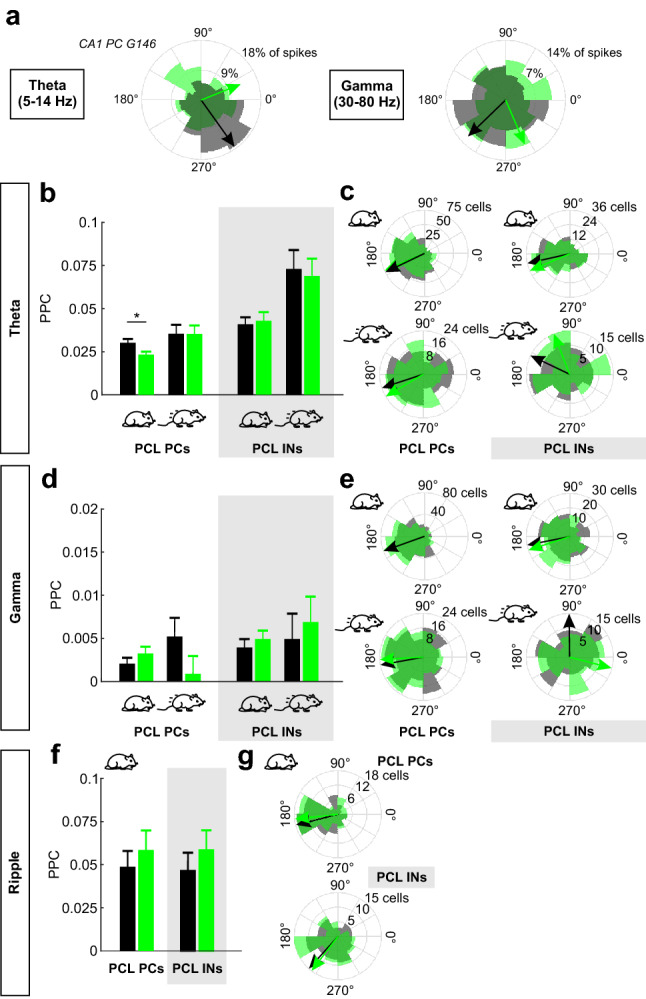
Figure 3.

Optogenetic silencing of PVIs disrupts spike-phase coupling of CA1 PCs. (a) Polar phase histograms of an example CA1 PC showing significant spike-phase coupling with theta (left) and gamma (right) oscillations during control conditions (grey areas). During light illumination significant spike-phase coupling is lost (green areas). Arrows indicate preferred oscillatory phase of firing. Length of the arrows is adjusted to the maximum of the respective polar phase histograms. (b) Strength of spike-theta phase coupling of CA1 PCs (left) and PCL INs (right, grey box) quantified by the pairwise phase consistency (PPC) during light on (black) and light off (green) periods. Resting and running periods were analyzed separately (schematic mice below). (c) Polar histograms depicting the distribution of preferred theta oscillation phases for the following conditions: CA1 PCs, resting mice (top left); PCs, running mice (bottom left); PCL INs, resting (top right); INs, running (bottom right). Grey areas summarize light off-, green areas light on periods. Black/green arrows indicate average oscillation phase of spiking. Light-mediated PVI silencing did not affect the average oscillation phases of spiking. (d) and (e) In analogy to (b) and (c), analysis of spike-gamma phase coupling of CA1 PCs and PCL INs with respect to the strength (d) and the preferred gamma phase of spiking (e) in resting and running mice. (f), (g) Analogous to (b) and (c), analysis of spike-ripple phase coupling of CA1 PCs and PCL INs regarding the strength of spike-ripple phase coupling (f) and preferred ripple phase of spiking (g) only for resting episodes. PCL, pyramidal cell layer. *p < 0.05.
