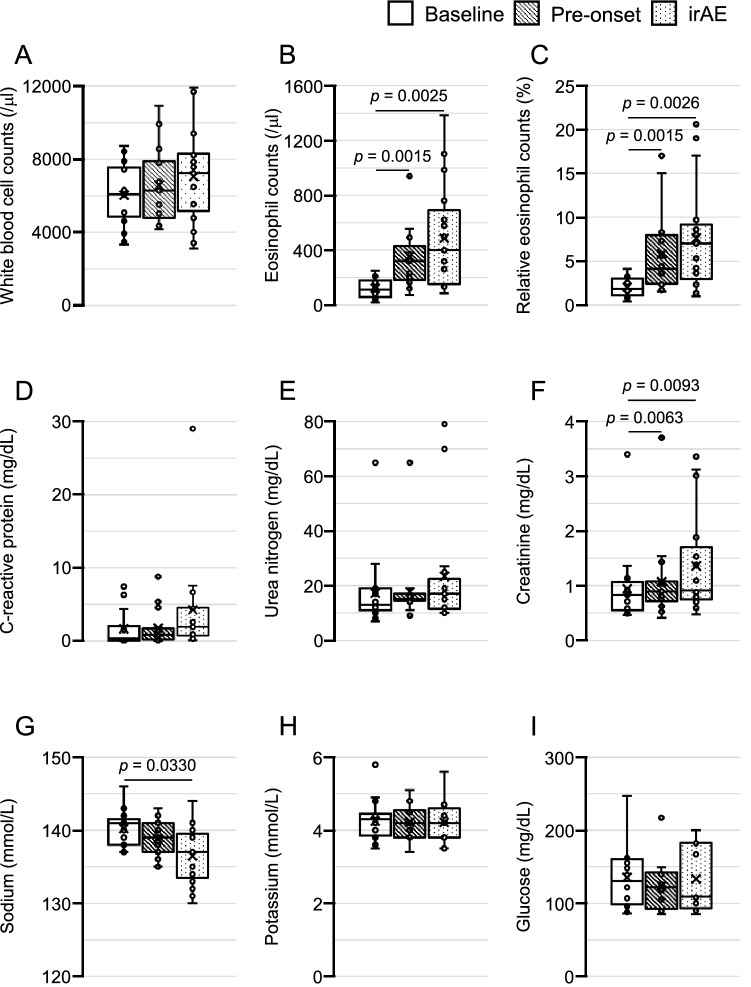
Figure 1.
Longitudinal data in the AI group are shown by box plots. (A) White blood cell counts, (B) absolute eosinophil counts, (C) relative eosinophil counts, (D) C-reactive protein levels, (E) serum urea nitrogen levels, (F) serum creatinine levels, (G), serum sodium levels, (H) serum potassium levels, and (I) plasma glucose levels. ‘Baseline’ represents data before the first administration of ICIs. ‘Pre-onset’ represents data checked-up just before the patients experienced AI symptoms. ‘irAE’ represents data at the diagnosis of ICI-induced secondary AI. Statistical analyses were performed by Friedman’s test corrected by Bonferroni’s method. Significant differences of p < 0.05 were indicated.

