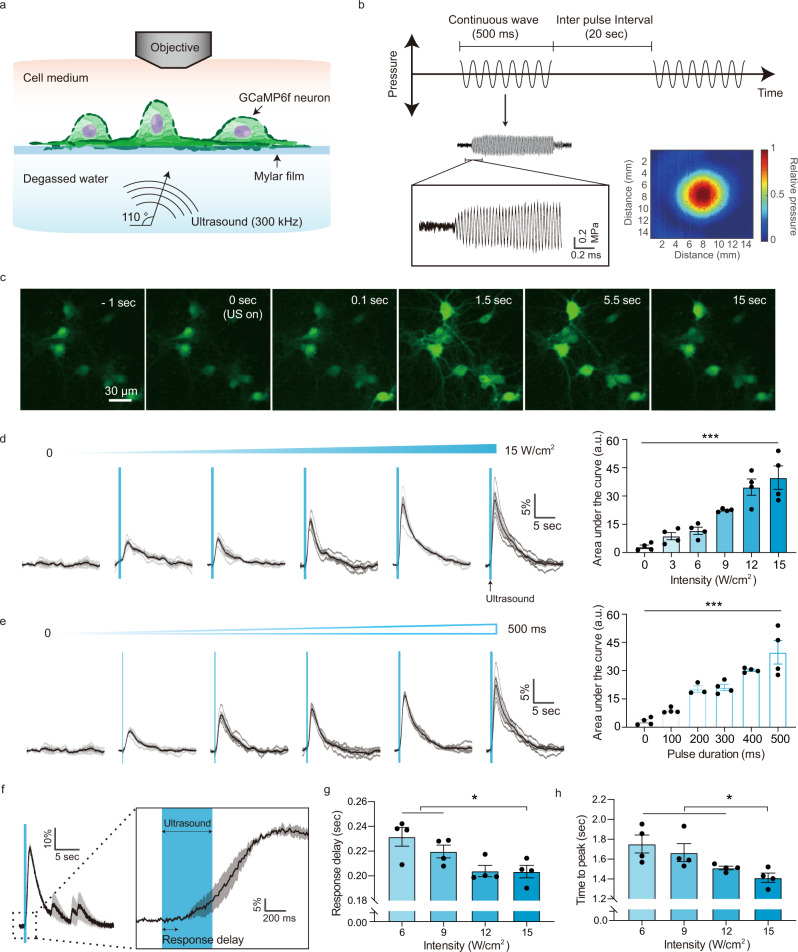
Fig. 1. Cultured cortical neurons are excited by focused ultrasound stimulation.
a Illustration of the focused ultrasound stimulation setup. Angled ultrasound waves (300 kHz) are delivered to GCaMP6f-expressing neurons cultured on an acoustically transparent mylar film, while the neural calcium response is recorded by epifluorescence imaging. b Schematic of the acoustic waveform applied to neurons and representative focal pressure waveform measured by a hydrophone. Temporal offset from the rectangular waveform (signal from function generator) reflects the focal length of the transducer. The colormap shows the spatial profile of the acoustic pressure at the ultrasound focus, with a full-width at half-maximal diameter 5.2 mm. c Representative time lapse images of GCaMP6f fluorescence before, during and after an ultrasound stimulation (15 W/cm2, 500 ms pulse duration at 0 s). d Calcium responses and quantification of neural response as function of ultrasound intensity (n = 4 independent experiments each, one-way ANOVA p < 0.0001) and e pulse duration (n = 4 independent experiments each, one-way ANOVA p < 0.0001). f A representative single cell response to ultrasound. g Quantification of response onset time (n = 4 independent experiments each, one-way ANOVA p = 0.0117, Tukey’s post comparison) and h time to peak (n = 4 independent experiments each, one-way ANOVA p = 0.0190, Tukey’s post comparison). Individual traces are gray solid, their mean trace is black solid, and SEM is shaded. Bar graph values represent mean ± SEM.

