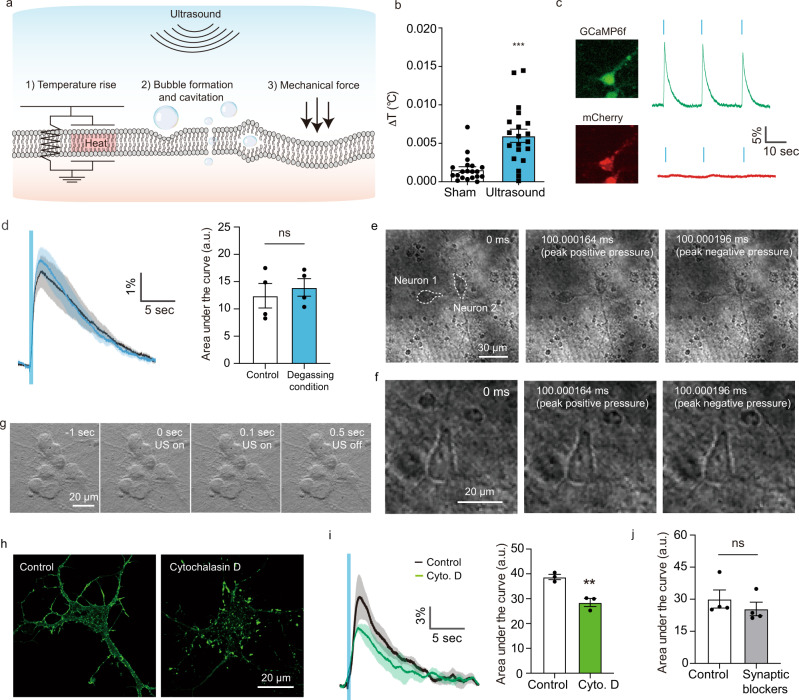
Fig. 2. Ultrasound excites neurons through direct mechanical effects.
a Illustration of the potential biophysical effects of ultrasound. b Temperature increase measured using an optic hydrophone thermometer positioned near the neurons during ultrasound stimulation (n = 20, 15 W/cm2, 500 ms pulse duration with 20 s inter-pulse interval, Unpaired T-test, two-tailed, p < 0.0001). c Fluorescence images of a neuron co-expressing GCaMP6f (green) and mCherry (red) and changes in their respective fluorescence in response to ultrasound stimulation. d Calcium responses to ultrasound in freshly degassed media (n = 4 independent experiments each, unpaired t-test, two-tailed, p = 0.6033). e Ultra-high-speed imaging (5 Mfps) of neurons and surrounding media during ultrasound stimulation. Image recording was started 100 ms after the onset of ultrasound. f Ultra-high-speed imaging of a single neuron during ultrasound stimulation at higher magnification. g Bright field imaging of neurons over the full time course of the ultrasound stimulation. h Images of individual neurons with the F-actin label Alexa-Fluor 488 phalloidin before and after treatment with cytochalasin D. i Calcium responses before and after cytochalasin D treatment, and quantification of area under the curve (n = 3 independent experiments, unpaired t-test, two-tailed, p = 0.0061). j Quantification of area under the curve after applying the synaptic blockers AP5 and CNQX (1 μM each, n = 4 independent experiments, paired T-test, two-tailed, p = 0.4128). Mean trace is solid and SEM is shaded. Bar graph values represent mean ± SEM.

