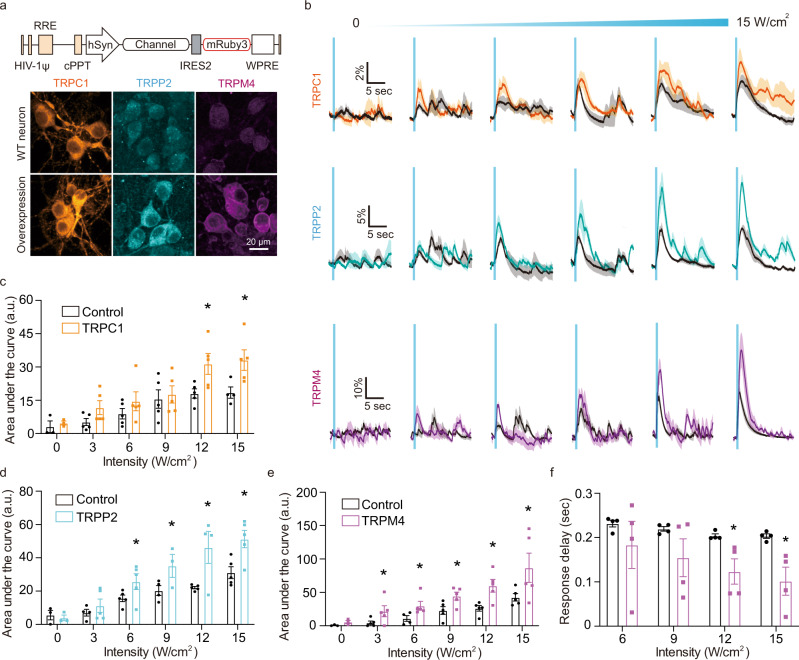
Fig. 7. Neuronal response to ultrasound is enhanced by overexpression of mechanosensitive and amplifier channels.
a Schematic of genetic constructs for overexpressing TRPC1, TRPP2, and TRPM4 and representative immunostaining images for the channels with and without overexpression. b Calcium responses from wild type neurons and overexpressing neurons as function of ultrasound intensity and quantification of area under the curve for c TRPC1 (n = 5 independent experiments each, Unpaired T-test, two-tailed, p = 0.0316 (12 W/cm2), p = 0.0369 (15 W/cm2)), d TRPP2 (n = 5 independent experiments each, Unpaired T-test, two-tailed, p = 0.0855 (6 W/cm2), p = 0.0795 (9 W/cm2), p = 0.0105 (12 W/cm2), p = 0.0127 (15 W/cm2)), and e TRPM4 (n = 5 independent experiments each, Unpaired t-test, two-tailed, p = 0.0815 (3 W/cm2), p = 0.0578 (6 W/cm2), p = 0.0317 (9 W/cm2), p = 0.0114 (12 W/cm2), p = 0.0841 (15 W/cm2)). f Comparison of response delay of calcium response between wild type and TRPM4-overexpressing neurons (n = 5 independent experiments each, Unpaired T-test, two-tailed, p = 0.0321 (12 W/cm2), p = 0.0442 (15 W/cm2)). Mean trace is solid and SEM is shaded. Bar graph values represent mean ± SEM.

