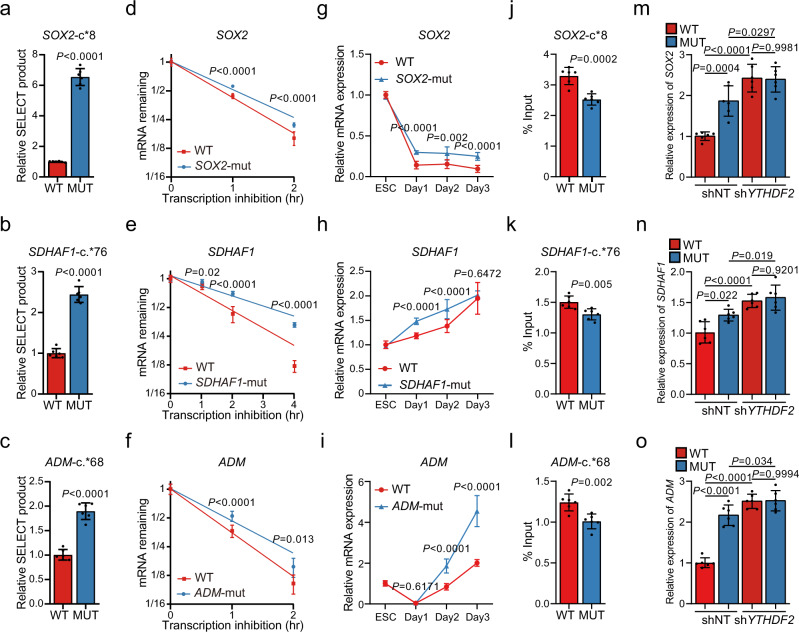
Fig. 4. Selected m6A disruptive mutations increase RNA stabilities depending on YTHDF2.
a–c Comparisons of SELECT-determined m6A levels at the targeted sites in SOX2-mut (a), SDHAF1-mut (b), and ADM-mut (c) hESCs with WT hESCs (n = 6 biologically independent samples). P-values were calculated vs. WT (two-tailed Student’s t-test). d–f mRNA half-life (t1/2) of SOX2 (d), SDHAF1 (e), or ADM (f) in WT, and mutant hESCs (n = 6 biologically independent samples). P-values were calculated vs. WT (two-tailed Student’s t-test). g–i mRNA expression levels of SOX2 (g), SDHAF1 (h), and ADM (i) in cultures derived from WT, SOX2-mut, SDHAF1-mut, and ADM-mut hESCs before and after DE differentiation measured by qPCR (n = 8 biologically independent samples in (g), n = 6 biologically independent samples in (h) and (i)). P-values were calculated vs. WT (two-tailed Student’s t-test). j–l RIP-qPCR analyses of the YTHDF2 binding at the mRNAs of SOX2 (j), SDHAF1 (k), and ADM (l) in cultures derived from WT and mutant hESCs at day 2 of DE differentiation (n = 6 biologically independent samples). P-values were calculated vs. WT (two-tailed Student’s t-test). m–o mRNA expression levels of SOX2 (m), SDHAF1 (n), and ADM (o) in cultures derived from WT and mutant (MUT) hESCs at day 2 of DE differentiation with or without YTHDF2 knockdown (n = 6 biologically independent samples). NT non-targeting; ns nonsignificant (one-way ANOVA with Tukey’s post hoc test). Data of all relevant panels are presented as means ± SD. Source data are provided as a Source Data file.

