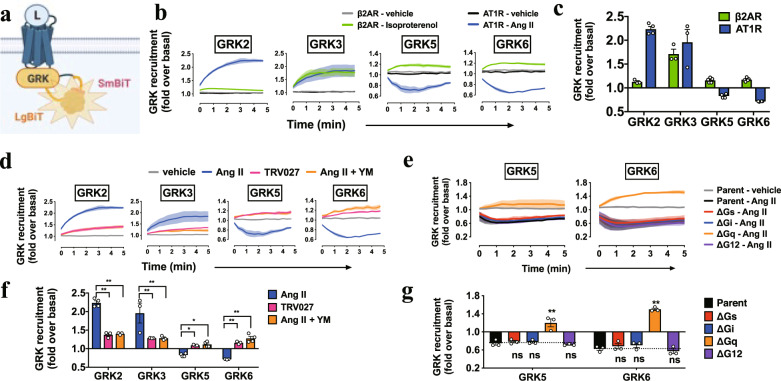
Fig. 5. Active Gq selectively disperses GRK5/6 from AT1R.
a–c, Schematic representation (a), luminescent kinetics (b), and quantifications (c) of the NanoBiT-GRK-recruitment assay. AT1R-Sm or β2AR-Sm was expressed together with the indicated GRK-Lg constructs in the parent cells and stimulated with Ang II (1 µM) or isoproterenol (10 µM). Note that owing to the time lag between manual ligand addition and start of kinetics measurement, luminescent signals were changed from the basal count (normalized to the value of 1) at the first reading (set as time = 0 min). d–g, NanoBiT-GRK recruitment in the TRV/Ang II + YM treatments (d, e) and the G-protein-deficient cells (f, g). HEK293A cells deficient for the individual G-protein families (∆Gs, ∆Gi, ∆Gq, ∆G12; each deficient for the Gα subunits expressed in HEK293A cells; see Methods for detail) were used to monitor Ang II (1 µM)-induced AT1R-GRK association (f, g). Note that vehicle plots from all of the cell lines overlapped tightly and only those from the parental cells were shown for clarity (f). In Fig. 5b, d, f, lines and shaded regions represent mean and SEM, respectively, of 3 (f) or 3–4 (b, d) independent experiments with each performed in duplicate. In Fig. 5c, e, g, bars and error bars represent mean and SEM, respectively, of 3 (g) or 3–4 (c, e) independent experiments with each performed in duplicate. In Fig. 5e, g, * and ** represent P < 0.05 and 0.01, respectively, with two-way ANOVA followed by the Dunnett’s test for multiple comparison analysis (with reference to the Ang II stimulation (e) or the Parent (g)). See Supplementary statistics data file for additional statistics and exact P values.

