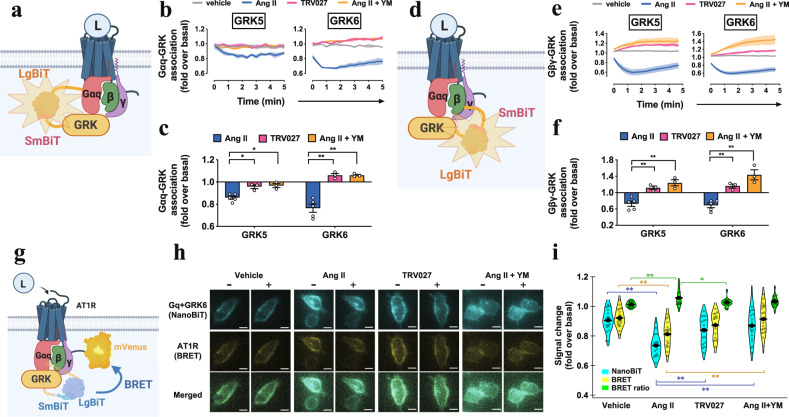
Fig. 6. Colocalization of AT1R, Gq and GRK5 molecules.
a–c, Schematic representation (a), luminescent kinetics (b), and quantifications (c) of the Gαq-GRK proximity assay. LgBiT-fused Gαq subunit and SmBiT-fused GRK were expressed along with AT1R and the Gβ1 and the Gγ2 subunits in the parent cells. d–f Schematic representation (d), luminescent kinetics (e), and quantifications (f) of the Gβγ-GRK proximity assay. Same as in (a–c), but using the SmBiT-fused Gβ1 and the LgBiT-fused GRK constructs. The indicated reporter-expressing cells were stimulated with Ang II (1 µM), TRV027 (1 µM) or Ang II (1 µM) + YM (1 µM) (b, c, e, f). Shaded regions denote SEM (n = 3–5; b, e). In all panels, * and ** represent P < 0.05 and 0.01, respectively, with two-way ANOVA and following the Dunnett’s test for multiple comparison analysis (n = 3–5 in dots; with reference to Ang II or Parent). g–i, Schematic representation (g), microscopic imaging (h), and quantifications (i) of the NanoBiT-BRET assay to assess proximity of the three AT1R-Gq-GRK components. Gαq-Lg, Sm-GRK6 and AT1R-mVenus were expressed in the parent cells. The complemented NanoBiT luciferase signal and the BRET signal via mVenus were imaged before and after the indicated stimulation conditions (h). Fold-changes of NanoBiT, mVenus and BRET ratio index were indicated in (i). * and ** represent P < 0.05 and 0.01, respectively, with the Tukey’s test among 4 groups (n = 17–21 cells). In Fig. 6b, e, lines and shaded regions represent mean and SEM, respectively, of 3–5 independent experiments with each performed in duplicate. In Fig. 6c, f, Bars and error bars represent mean and SEM, respectively, of 3–5 independent experiments with each performed in duplicate. In Fig. 6h, representative images of 17–21 cells were shown. In Fig. 6i, shaded regions represent a histogram of 20–29 cells. In Fig. 6c, f, i, * and ** represent P < 0.05 and 0.01, respectively, with two-way ANOVA followed by the Dunnett’s test (c, f) or the Tukey HSD test (i) for multiple comparison analysis (c, f; with reference to the Ang II stimulation). See Supplementary statistics data file for additional statistics and exact P values.

