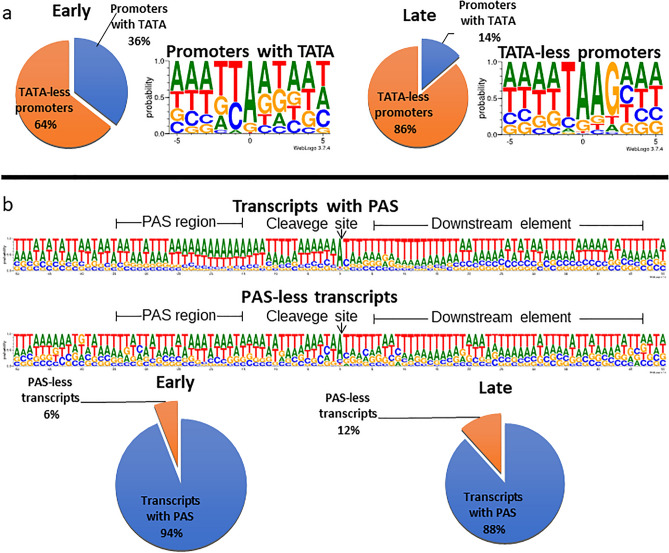
Figure 2.
Utilization of TATA box and polyadenylation signal (PAS) in early and late viral transcripts. (a) The pie charts show the percentage of TATA (blue) and non-TATA (orange) promoters for early (5 m, 1 h, 2 h, 4 h, and 6 h) and late (16 h, 24 h, 48 h, and 72 h) time points. The pie chart was created with Microsoft Excel 2021 software48. (b) The weblogo shows the probability of the occurrence of TSSs and nucleotides in their genomic environment. The weblogo shows the poly(A) signal in the downstream element and the probability of occurrence of nucleotides in their vicinity. Pie charts for early (5 m, 1 h, 2 h, 4 h, 6 h) and late (16 h, 24 h, 48 h, 72 h) time points show the percentages of transcripts with poly(A) signal (blue) and without Poly(A) signal (orange). The weblogo image is generated using weblogo 3.049. The pie chart was created with Microsoft Excel 2021 software48.

