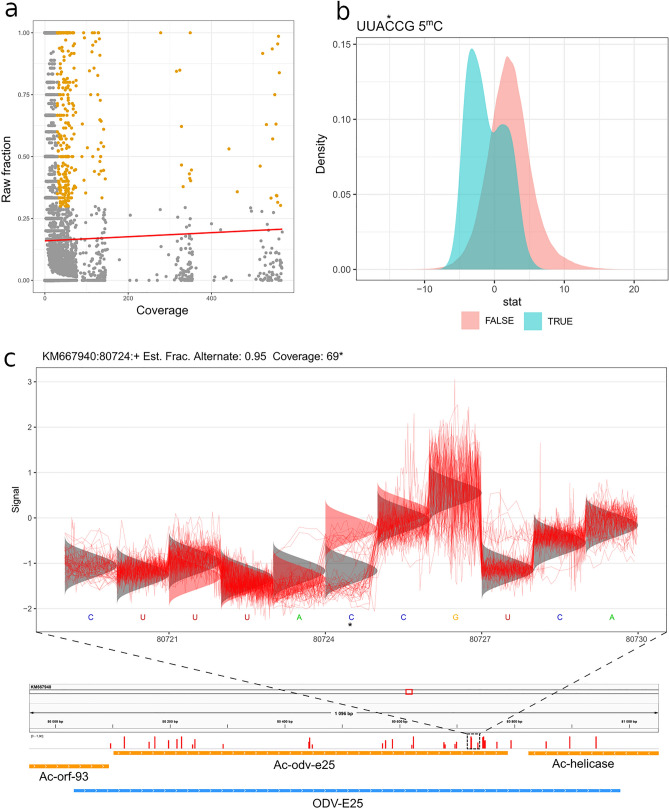
Figure 4.
5-mC methylation of AcMNPV transcripts. (a) No significant correlation was observed between the coverage and the number of methylated nucleotides in the raw fraction. Yellow dots indicate positions designated for further analysis. The plot was made with the ggplot2 r package53. (b) Test statistics of UUAC*CG sequence (methylated positions are labelled by asterisks). This panel plots a distribution of test statistics for motif-matching and non-motif-matching sites for all of the provided motives. The plot was made with the ggplot2 r package53. (c) A putative methylated cytosine of the readthrough part of ODV-E25 transcript (5-mC labelled by asterisk). The red curves indicate the electric signals, while the densities indicate the alternative signal levels. The plot was made with the tombo 1.5.1 software44.

