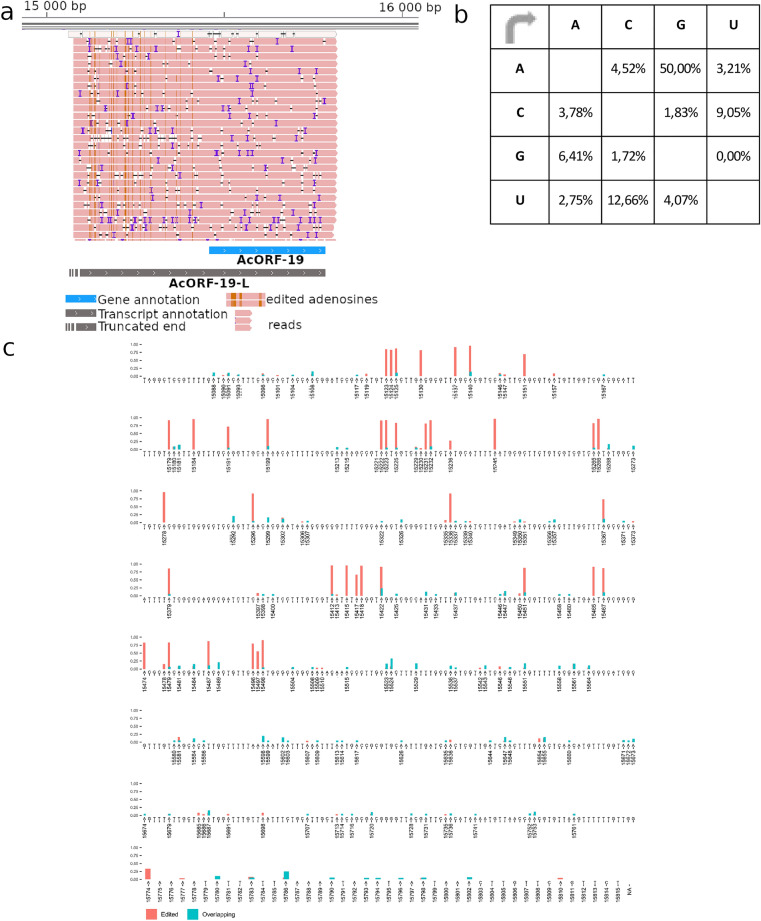
Figure 5.
Hyper-editing of AcORF-19 transcript. (a) A- > I hyper-edited AcORF-19 reads. The image shows the AcORF19-L transcript reads in pink. The brown lines on the reads indicate base modifications. These modifications are located in the 5′-UTR of the canonical transcript. The reads were visualized with IGV 2.11.3 software55. (b) Substitution matrix of AcORF-19 reads. Reference nucleotides are found on the left side of the substitution matrix, while the right side of the matrix contains the percentage of nucleotides. It can be seen that that more than 50% of them are G letter. The substitution matrix was created with Microsoft Excel 2021 software48. (c) The sites and frequency of A- > G substitution on AcORF-19 transcript (indicated on the genomic region encoding this transcript). High-frequency substitutions indicate A- > G editing events, whereas low-frequency substitutions indicate sequencing errors. Red color indicates the high, whereas blue color shows the low frequency of editing. The plot was made with the ggplot2 r package53.

