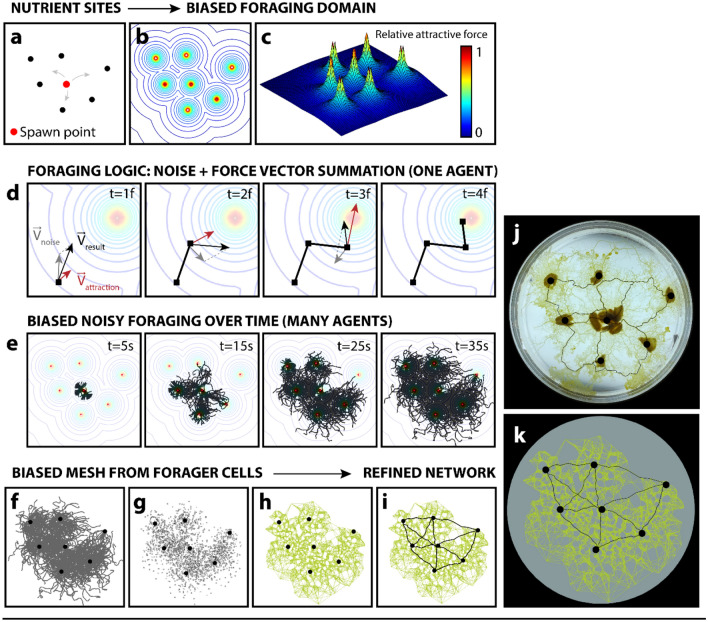
Figure 3.
Modelled Physarum growth logic. (a) Plot showing seven reference food sources. (b) Contour plot of the force field generated from (a). (c) Surface topography showing relative attraction force intensity of (b). (d) Illustrated foraging logic for a single agent. At each frame, the noise vector is summed with the attraction vector, generated as a function of proximity to food source. (e) Screen captures of agent-based model growth over time until all food sources have been colonized. (f) Final agent path geometry, from t = 35 s. (g) Point cloud from paths in (f). (h) Mesh generated from points in (g). (i) Shortest-walk calculation to produce refined network from mesh in (h). (j–k) Biological versus modelled mesh growth with overlaid network for equivalent reference food sources.

