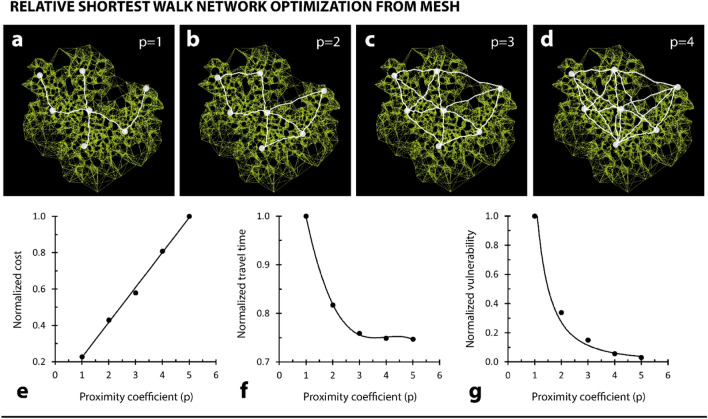
Figure 4.
Tunable modelled network behaviour. (a–d) Different shortest-walk calculations for the same mesh, but with unique proximity coefficient values. (e) Plot relating network cost, normalized to the largest cost, to proximity coefficient. Trendline is a linear function. (f) Plot relating network travel time, normalized to the largest travel time, to proximity coefficient. Trendline is a third-order polynomial function. (g) Plot relating network vulnerability, normalized to the largest travel vulnerability, to proximity coefficient. Trendline is a power function.

