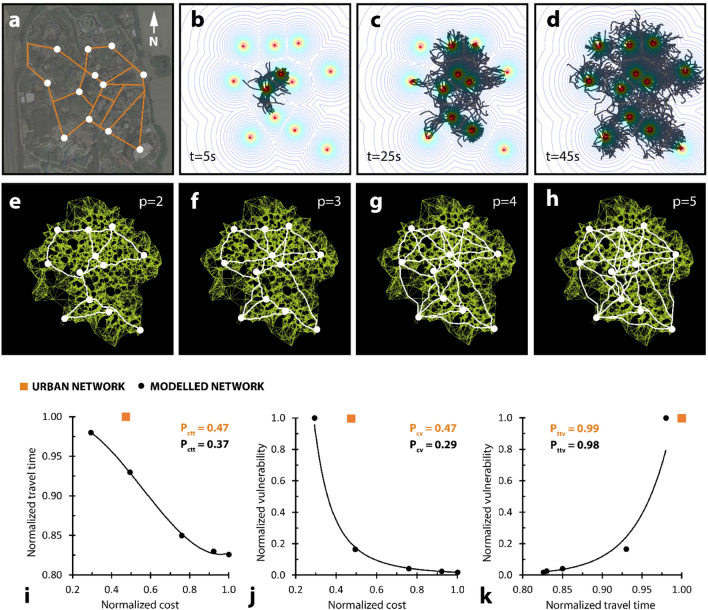
Figure 6.
Built versus modelled amusement park network performance is varied. (a) Network to describe Canada’s Wonderland. Background image obtained from Google Maps. (b–d) Modelled growth to establish mesh to describe Canada’s Wonderland. (e–h) Different shortest-walk calculations for the same mesh, generated from (d), but with unique proximity coefficient values. (i) Plot relating network cost to travel time for both built (orange) and modelled (black) networks. Trendline is a third-order polynomial function. (j) Plot relating network cost to vulnerability for both built (orange) and modelled (black) networks. Trendline is a power function. (k) Plot relating network travel time to vulnerability for both built (orange) and modelled (black) networks. Trendline is an exponential function. All performance values normalized to the largest local value. Modelled performance values displayed on the plots represent performance for the closest modelled point to the built point (orange) along the trendline.

