Figure 5.
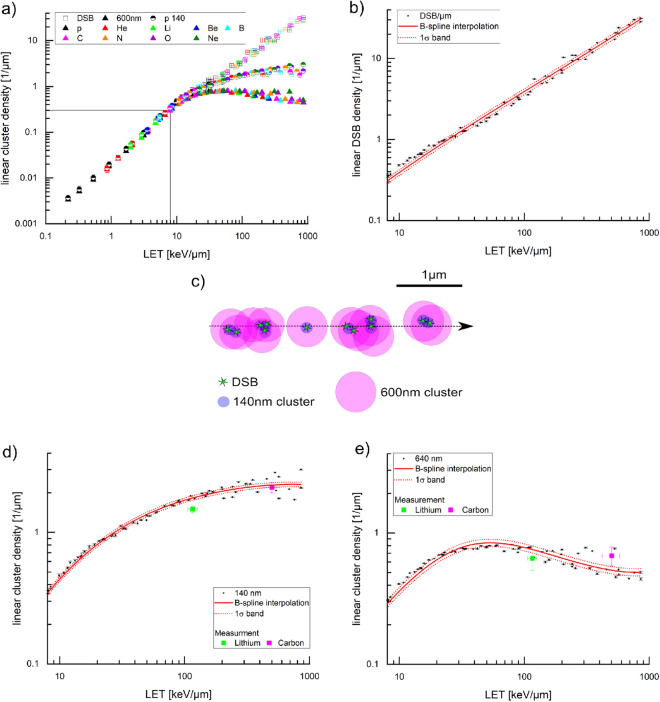
(a) Linear DSB density (empty squares) from PARTRAC simulation for nine different ions (hydrogen, helium, lithium, beryllium, boron, carbon, nitrogen, oxygen, and neon) over a LET range from 0.2 to 860 keV/µm. 140 nm clusters (semi-filled circles) and 600 nm clusters (filled triangles) from PARTRAC simulated DSB clusters with the method depicted in (c). Black lines give the lower termination criterion. (b) Linear DSB density with B-spline (red line) and the corresponding 1σ confidence band (dashed, red line). (c) Visualization of the method of clustering the DSB from the simulation. Green stars represent 12 DSB. The violet circles are the six clusters with 140 nm and the pink circles are the 640 nm clusters. (d) Linear cluster density for 140 nm (d) and 640 nm (e) cluster width with B-spline (red line) and the corresponding 1σ confidence band (dashed, red line). The measured data for pDNA-PKcs are shown for both lithium (green) and carbon ion (magenta) irradiation. In (d) and (e), the y-axis is zoomed in to a maximum value of 4 µm−1.

