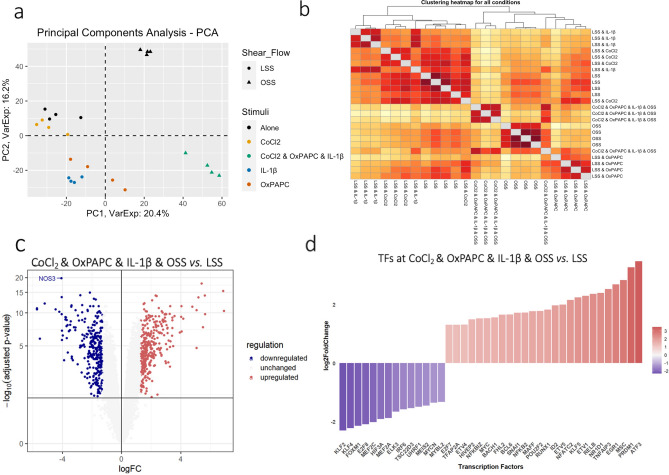
Figure 2.
Gene expression profile revealed the hierarchical contribution of the CVD risk factors CoCl2, OxPAPC, IL-1β and OSS and key TFs relevant to endothelial function. (a) Principal Component Analysis (PCA) of gene expression profile from each sample showed that the PC1 explained 20.4% of the variation while PC2 16.2%. (b) Hierarchical clustering heatmap using Euclidean distance as a measured parameter revealed details of hierarchical contribution by each condition according to their distance to the LSS. (c) Volcano plot showed the differentially expressed genes (DEGs) when comparing the clustered risk factors vs. LSS. The DEGs were considered as adjusted p-value < 0.05 and |Log2foldchange|> 1.3. (d) TF identified among the DEGs and their respective log2 foldchange. Genes in blue are downregulated and in red are upregulated.

