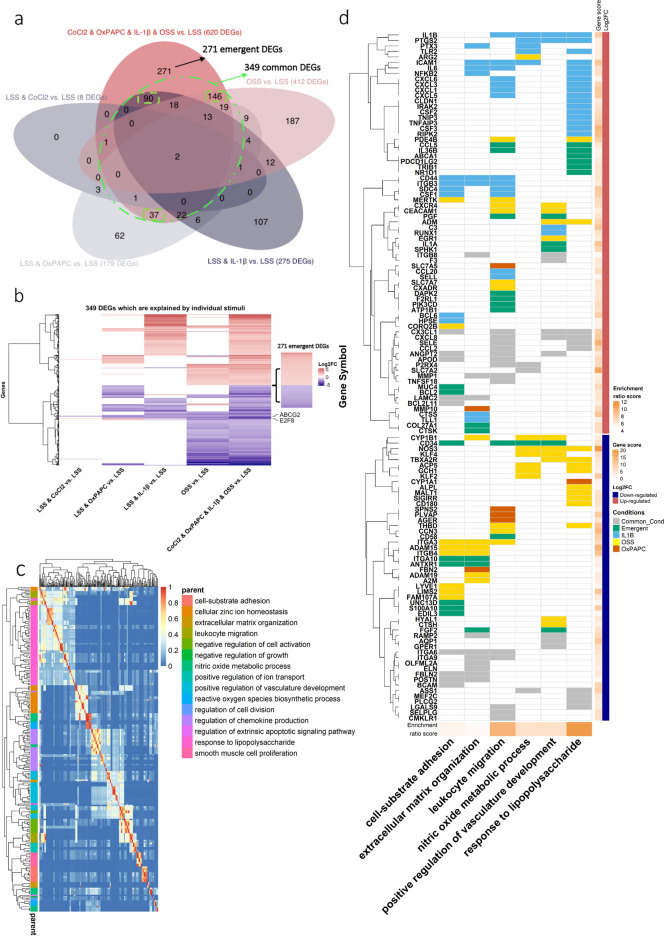
Figure 3.
Dysregulated DEGs distribution on individual and clustered risk factors followed by GO map of biological process enriched for the 620 DEGs of the clustered risk factors vs. LSS. (a) Venn diagram of DEGs from each condition. The DEGs were considered as adjusted p-value ≤ 0.05 and |Log2foldchange|≥ 1.3; black circle and black arrow regard the unique DEGs from the clustered risk condition; dashed green circle and green arrow regard to the commonly shared genes of the clustered risk factors with each stimulus; dashed black line for unique stimuli-dependent genes, 146 DEGs for OSS, 90 for IL-1β and 37 for OxPAPC. (b) Heatmap of 349 DEGs shared among the DEGs from each stimulus. (c) Heatmap of the similarity matrix of enriched GO terms (biological process) for the clustered risk factors DEGs. Redundancy analysis was applied to identify and keep the most representative term from the redundant terms (cutoff = 0.7 and adjusted p-value ≤ 0.05). (d) Canonical enriched terms in CoCl2 & IL-1β & OxPAPC & OSS vs. LSS (121 DEGs) and the
source of the stimulus individual (represented by colours light blue, yellow and orange), common (grey), more than one stimulus, and if it is emergent, meaning that the gene is only altered if all four stimuli are combined (green). Gene score and enrichment risk score were calculated by − log10(adjusted p-value).

