Figure 5.
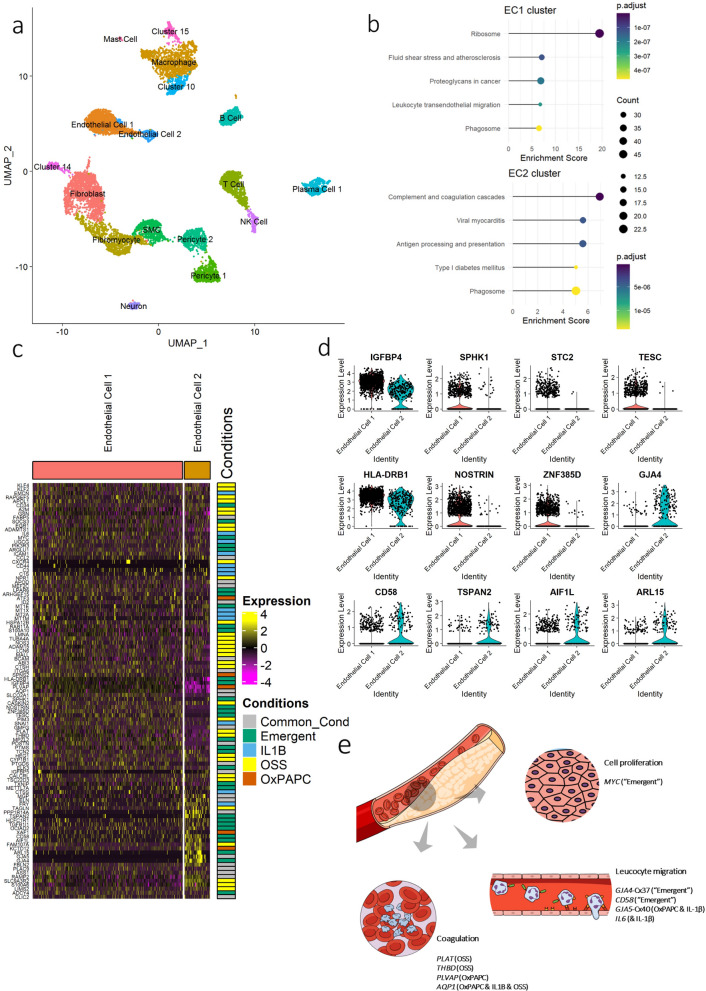
scRNA-seq of human coronary artery atherosclerotic plaque identified two endothelial cells (EC) clusters which are defined by the clustered risk factors DEGs. (a) UMAP visualization of clustering identified 17 cell populations (n = 10,671 cells). (b) KEGG enrichment analysis of the two EC clusters using the cluster marker differentially expressed genes between a cluster and all remaining cells. DEG were considered for adjusted p-value ≤ 0.05 and |Log2foldchange|≥ 0.25. (c) Heatmap of the 103 clustered risk factors DEGs expression levels from each endothelial cell of the two clusters followed by the condition in which they are differentially expressed. (d) Violin plot of emergent DEGs which are differentially expressed in EC2 vs. EC1. (e) Schematic illustrating the key dysregulated pathway in the clustered risk factors which are recapitulated in human atherosclerotic plaque. (e) Created in the Mind the Graph platform (www.mindthegraph.com).

