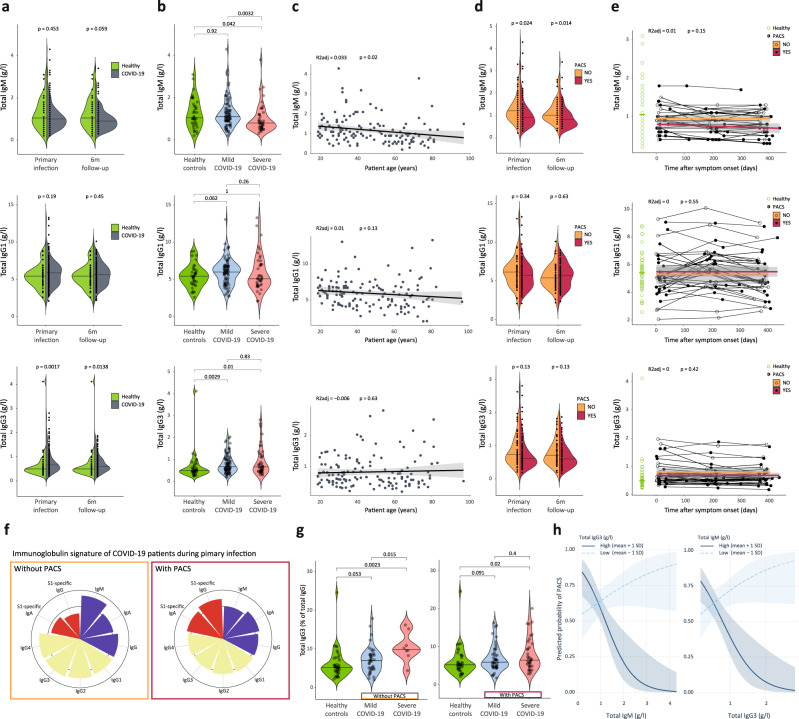
Fig. 2. Specific and total immunoglobulins at primary infection and follow-up.
a and b Total serum concentrations of IgM, IgG1, and IgG3 in healthy controls (n = 40) versus (a) all (n = 134 at primary infection; n = 115 at 6-month follow-up) or (b) mild and severe COVID-19 cases at indicated timepoints (n = 89 and 45 respectively). c Ig titers at primary infection as a function of age in COVID-19 patients (n = 134), with adjusted R2 (R2adj) and p values of linear models (shown with 95% confidence interval [CI]). d Ig signatures in patients without and with PACS, during primary infection (n = 49 and 85 respectively) and 6-month follow-up (n = 41 and 74 respectively). e Ig titers in patients attending all follow-up visits (n = 34) as a function of days after symptom onset, with R2adj and p values of generalized additive model (shown with 95% CI). Corresponding patients without (circles) and with PACS (dots) are connected, with a spline visualized for both groups. Green horizontal line indicates median in healthy controls. f Radar plots with wedge sizes representing median Ig concentrations of patients without and with PACS (n = 49 and 85 respectively), normalized to median concentrations of all patients. g IgG3 percentages of total IgG in healthy controls (n = 40) and mild and severe COVID-19 cases without (left; n = 41 and 8, respectively) and with PACS (right; n = 48 and 37, respectively) during primary infection. h Interaction plot showing the conditional effects of IgM and IgG3 titers on the predicted probability of PACS in patients with high or low Ig titers (mean ± 1 standard deviation [SD]; n = 134, with 85 having PACS), using a logistic regression model (PACS score) adjusted for age, number of symptoms during primary infection, and history of asthma bronchiale (shown with 80% CI for visualization). Variables were compared using a two-sided Wilcoxon’s test.

