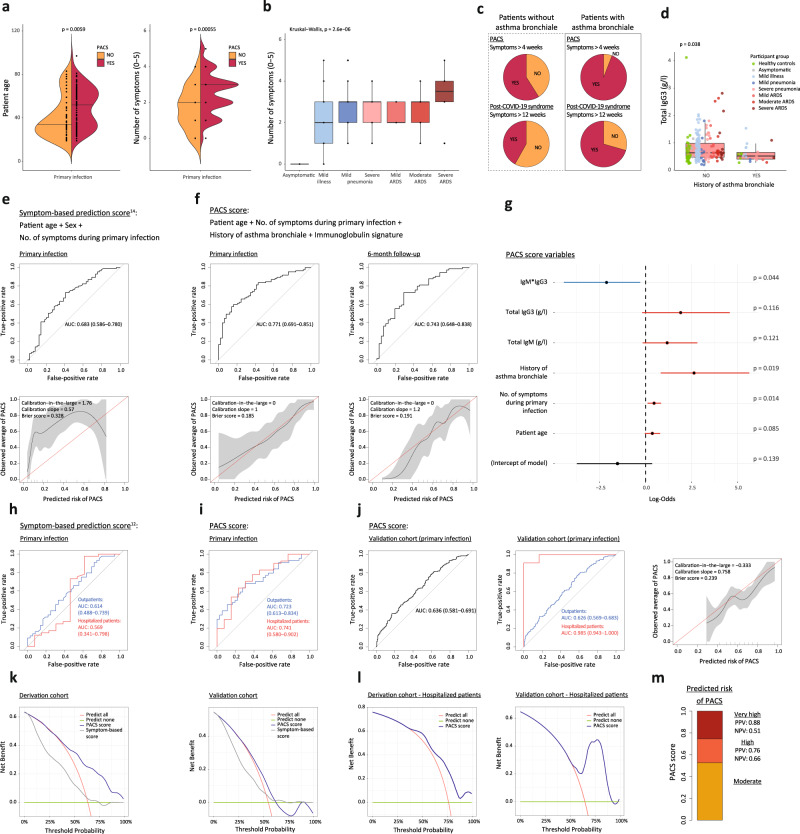
Fig. 3. Prediction of post-acute COVID-19 syndrome (PACS) based on clinical features and immunoglobulin signature.
a Age and number of symptoms during primary infection (0–5; fever, fatigue, cough, dyspnea, gastrointestinal symptoms) in patients without or with PACS. b Number of symptoms during primary infection in COVID-19 patients with different disease severities (n = 134, with 85 having PACS). c PACS and post-COVID-19 syndrome in patients without and with history of asthma bronchiale. d IgG3 titers in healthy controls (green symbols) and all COVID-19 patients (n = 215; disease severity indicated by colors) at primary infection, without or with history of asthma bronchiale. e and f Receiver operating characteristic (ROC) curves (top) and calibration plots (bottom) reporting the area under the curve (AUC) with 95% confidence intervals (CI) or calibration-in-the-large, calibration slopes, and Brier scores of logistic regression models for predicting PACS. Use of (e) a symptom-based model14 and (f) the PACS score on data of our patient cohort at primary infection (e and f, left; n = 134, with 85 having PACS) and after shrinkage of coefficients on 6-month follow-up-data (f, right; n = 115, with 74 having PACS). g Regression coefficients of PACS score with 95% CI and p values. h and i ROC curves reporting AUC with CI of PACS score in outpatients (blue) and hospitalized patients (red) of derivation cohort (n = 80 and 54, with 44 and 41 having PACS, respectively). j Validation of PACS score in independent cohort at primary infection (n = 389, with 212 having PACS) and subgroup analysis in outpatients (blue; n = 372, with 201 having PACS) and hospitalized patients (red; n = 17, with 11 having PACS). k Decision curve analysis of PACS score in derivation (left) and validation cohort (right) comparing the PACS score to a symptom-based score14 and clinical strategies of predicting none or all subjects with COVID-19 develop PACS. l Decision curve analysis of PACS score in hospitalized patients. m Estimated risk groups based on two probability thresholds (0.523 and 0.746) with corresponding positive (PPV) and negative (NPV) predictive values in the derivation cohort. Boxplots represent median (middle line) with upper and lower quartiles (box limits), and 1.5*interquartile ranges (whiskers). Variables were compared using a two-sided Wilcoxon’s test if not specified otherwise.

