Figure 4.
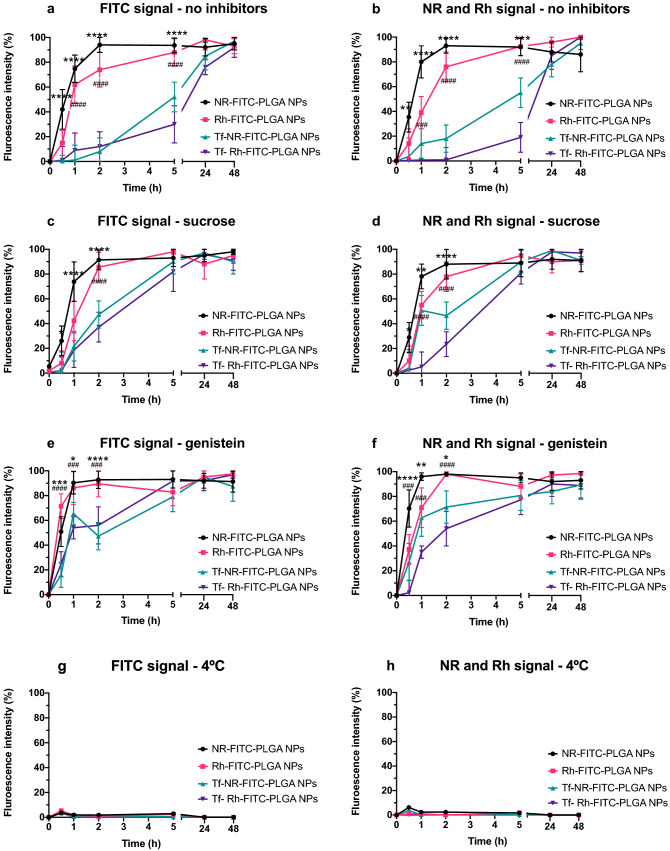
Flow cytometry analysis of NPs uptake under the different conditions assayed. (a,c,e,g) present the fluorescence intensity collected in the green channel under the different conditions assayed: (a) no uptake inhibition; (c) clathrin-dependent endocytosis inhibition (sucrose); (e) caveolae-dependent endocytosis inhibition (genistein); and (g) energy-dependent uptake inhibition (4 °C) respectively, representing the fluorescence intensity due to FITC associated to the polymer in NPs, and thus associated to the presence of NPs. (b,d,f,h) show the corresponding fluorescence intensity obtained in the red channel for the lipophilic fluorophore (NR) and the hydrophilic fluorophore (Rh), associated to the uptake of either lipophilic or hydrophilic molecules encapsulated in the NPs under the different conditions of uptake inhibition assayed. Statistically significant differences in fluorescence intensity (%) values between plain NR-FITC-PLGA NPs and Tf- NR-FITC-PLGA NPs are highlighted as *p < 0.0332; **p < 0.0021; ***p < 0.0002; ****p < 0.0001. Statistically significant differences in fluorescence intensity (%) values between plain Rh-FITC-PLGA NPs and Tf- Rh-FITC-PLGA NPs are highlighted as #p < 0.0332; ##p < 0.0021; ###p < 0.0002; ####p < 0.0001.

