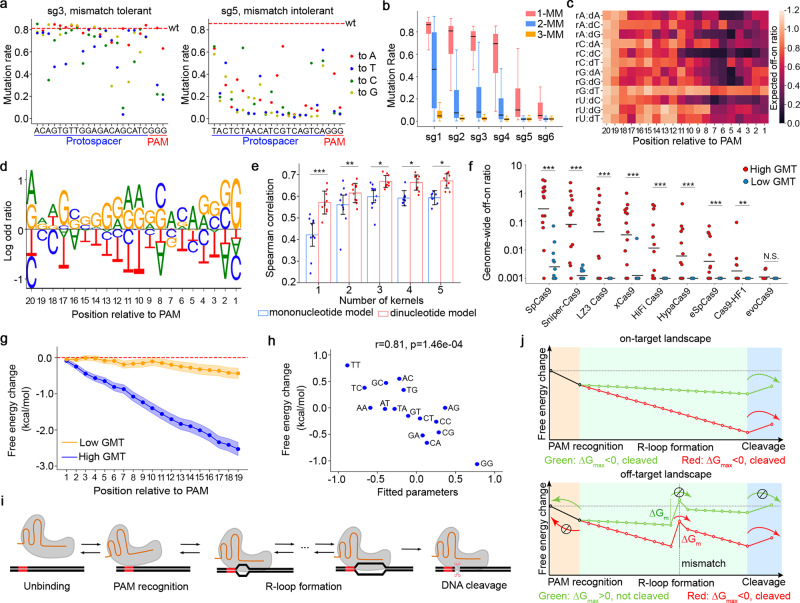
Fig. 2. The guide-intrinsic mismatch tolerance (GMT) and its underlying biophysical mechanism.
a The mutation rates at 1-mismatch target sequences of two example gRNAs that are associated with high GMT (left) and low GMT (right). Each dot corresponds to a specific mismatched target. The red dashed line represents the mutation rate at perfectly matched target. b A box plot showing the distributions of off-on ratios of 6 gRNAs at synthetic single targets harboring 1-, 2-, or 3-mismatches. The data represent n = 66 1-MM, 2,079 2-MM, and 100 3-MM gRNA-target pairs for each gRNA. The box plot displays a median line, interquartile range boxes and min to max whiskers. c A heatmap showing the mismatch-dependent effect conditioned on the position and nucleotide context of the mismatch. rX:dY represents a mismatch where a nucleotide X in crRNA is paired with a nucleotide Y in the complementary target DNA. d A sequence logo demonstrating the log-odds ratios of nucleotide frequency between gRNAs with high GMT (top 25%) and low GMT (bottom 25%). e Performance comparison of the mononucleotide and dinucleotide models in the prediction of GMT, with various numbers of convolutional kernels. Each dot represents an iteration of 10-fold cross-validation. *p<0.05, **p < 0.01, ***p < 0.001. The p-values were calculated using two-tailed t-test. Data (n = 10) are presented as mean values ±SD. The exact p-values from left to right are: 1.8e-04, 9.6e-03, 0.011, 0.017, 0.027. f A dot plot showing the specificity of the gRNAs predicted to be of high GMT (top 25%, n = 15) or low GMT (bottom 25%, n = 15), across a panel of Cas9 variants. The gRNA specificity is measured as the ratio of genome-wide off-target read counts to on-target read counts in TTISS experiments18. **p < 0.01, ***p < 0.001. The p-values were calculated using two-tailed Manny-Whitney U test. The exact p-values from left to right are: 4.72e-05,1.68e-05, 3.32e-05, 1.22e-04, 9.75e-05, 6.93e-04, 6.93e-04, 0.019, 0.08. g The average free-energy landscapes of the gRNAs are associated with high GMT (top 25%) or low GMT (bottom 25%). The shadows represent standard error for 95% confidence interval. h A scatter plot showing the correlation between the fitted dinucleotide parameters in the prediction model and the differences of base-stacking energy between DNA-DNA and RNA-DNA hybridizations31. The dinucleotide parameters reflect the contributions of dinucleotides to GMT prediction. To avoid confounded interpretation, the parameters shown in the plot were fitted using a single kernel model. The p-value was calculated using Pearson correlation test. i A schematic plot illustrating the kinetic transition of the states during Cas9-mediated target editing. j An illustration of the free-energy landscapes of a high-GMT gRNA (red) and a low-GMT gRNA (green) at an on-target (top panel) or a 1-MM off-target (bottom panel) sites. The mismatch introduces an energy barrier () during R-loop formation. The probability of overcoming the energy barrier is determined by its size relative to the barrier to unbinding, . The stop symbol represents the repressed direction of the reaction. The arrow represents the direction of the reaction. Source data for Fig. 2c–h are provided in the Source Data file.

