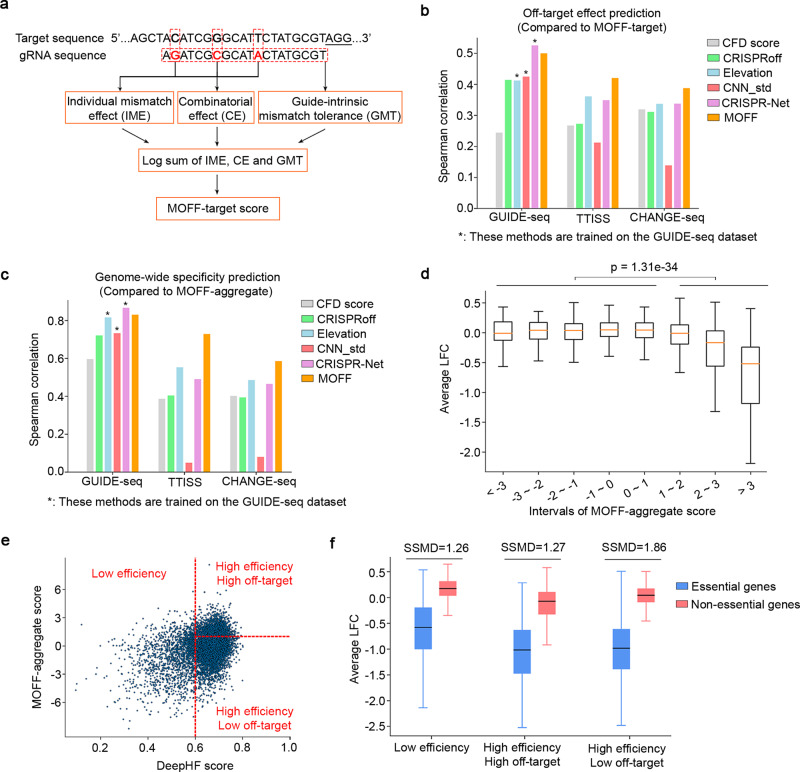
Fig. 4. Prediction of off-target effect and gRNA specificity with MOFF.
a A schematic representation of the workflow of MOFF-target. b, c Comparison of the performance of b MOFF-target and c MOFF-aggregate to other methods in the prediction of b off-target effect at a specific genomic locus, or c genome-wide gRNA specificity defined as the total read counts at the off-target sites relative to the on-target read counts. The performance is measured by the Spearman correlation between the predicted and observed values at a log scale. See Methods section for details of method comparison. *: methods trained on the GUIDE-seq dataset. d 2408 gRNAs targeting non-essential genes70 in the Avana library were grouped based on MOFF-aggregate scores. The box plot shows the distributions of average gRNA depletion (log-fold change, LFC) in viability screens across 342 cancer cell lines with respect to each group of gRNAs, n = 59, 103, 234, 484, 686, 543, 209, and 90 gRNAs within each score interval from left to right. The viability screening data were retrieved from the web portal of DepMap project43. The p-value was calculated using the two-tailed Mann–Whitney U test comparing the LFC of gRNAs with MOFF-aggregate scores smaller and larger than 1. The box plot displays a median line, interquartile range boxes, and min to max whiskers. e A scatter plot showing the categorization of 8021 gRNAs targeting core essential genes or non-essential genes in the Avana library, based on gRNA activity (DeepHF score44, x-axis) and gRNA specificity (MOFF-aggregate score, y-axis). The red dashed lines used for gRNA categorization represent MOFF-aggregate score = 1 (horizontal) and DeepHF score = 0.6 (vertical), respectively. f A box plot comparing the distributions of the depletion of gRNAs targeting essential or non-essential genes in the DepMap viability screens. The data represent n = 969 essential, and 665 non-essential gRNAs in “low efficiency” group, n = 945 essential, and 842 non-essential gRNAs in “high efficiency high off-target” group, and n = 3038 essential, and 1566 non-essential gRNAs in “high efficiency low off-target” group. Strictly standardized mean difference (SSMD) scores are computed as the measure of effect size in the screens. The box plot displays a median line, interquartile range boxes, and min to max whiskers. Source data for Fig. 4b–f are provided in the Source Data file.

