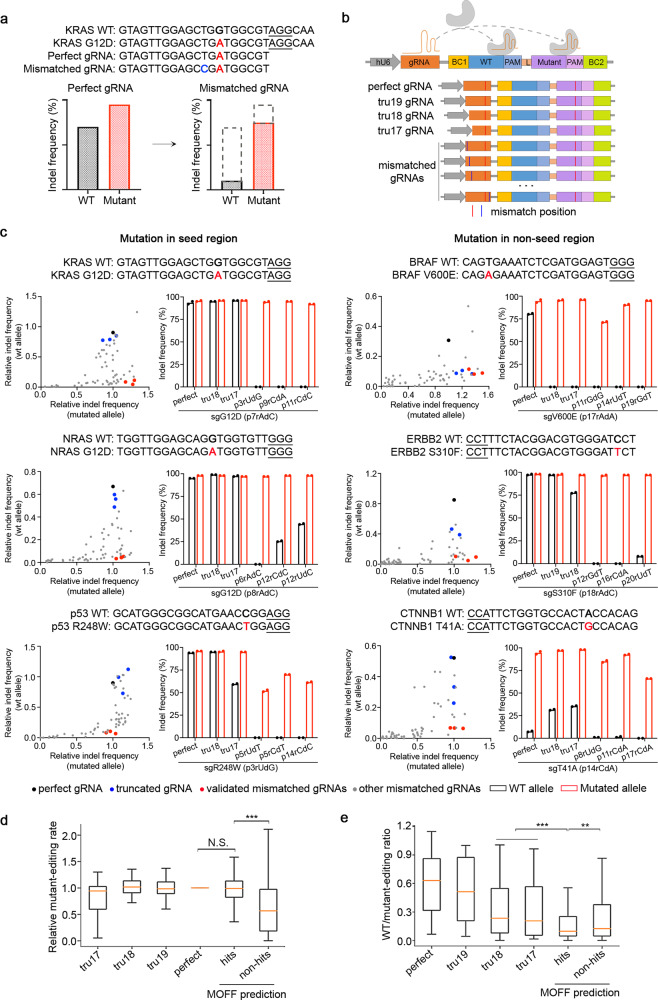
Fig. 5. Improvement of allele-specific genome editing with mismatched gRNA.
a A conceptual illustration of improving the selectivity of allele-specific editing using mismatched gRNA exemplified by KRAS G12D sequence. Nucleotides highlighted in colors represent the original mutation (red) and the introduced mismatch (blue). PAM sequence was indicated by an underline. b A schematic representation of experimental design of the allele-editing library using the dual-target system. c Experimental validations of the selectivity of allele-specific editing on 6 selected cancer hotspot mutations. The scatter plot of each mutation on the left shows the result of the high-throughput allele-editing screen. Relative indel frequency to wildtype or mutant allele was normalized by the indel frequency of perfect gRNA on the mutant allele. The bar chart on the right displays the validation results of indel frequency on wildtype and mutant alleles using one perfect, two truncated, and three effective mismatched gRNAs in HEK293T cells integrated with wildtype or mutant allele-target sequence. There are 2 biological replicates for each genomic sample. d Comparison of relative mutant-editing rate on MOFF predicted hits to perfect gRNA and MOFF predicted non-hits. e Comparison of the selectivity using wildtype to mutant-editing ratio on MOFF predicted hits to 17-18 nt truncated gRNAs and MOFF predicted non-hits. d, e **p < 0.01, ***p < 0.001, N.S.: not significant. The data represent n = 29 (tru17), 32 (tru18), 35 (tru19), 35 (perfect), 349 (hits), and 1,659 (non-hits) gRNA-targets pairs in the screen. The box plots display a median line, interquartile range boxes and min to max whiskers. The exact p-values from left to right are: d p = 0.55, p = 4.78e-41, and e p = 1.88e-04, p = 5.02e-03. The p-values were calculated using two-tailed Manny–Whitney U test. Source data for Fig. 5c–e are provided in the Source Data file.

