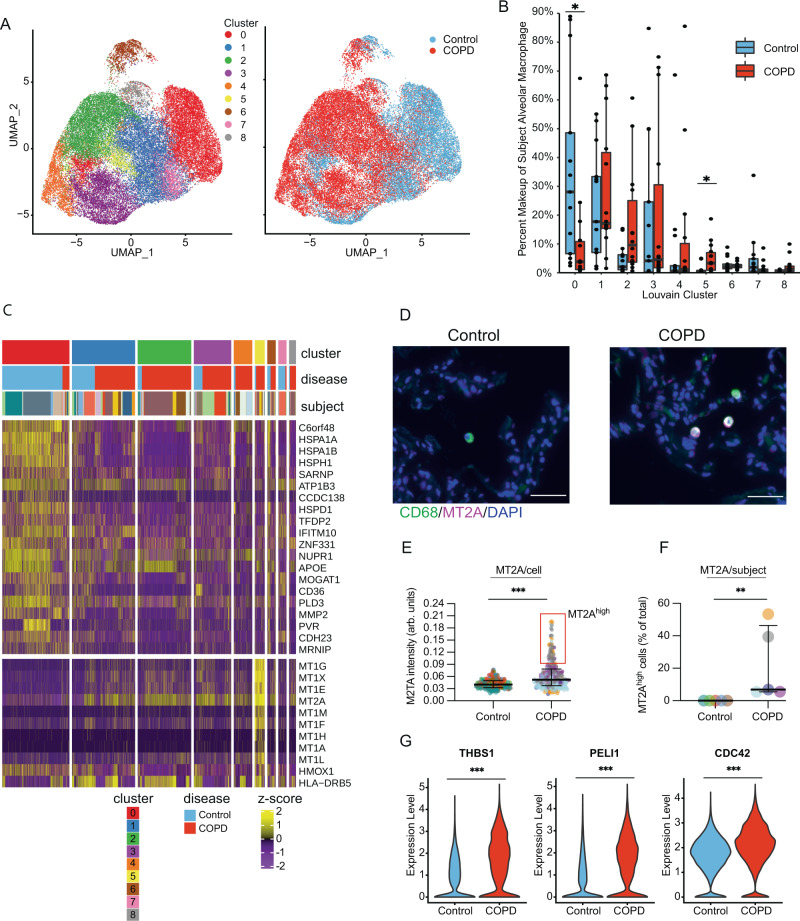
Fig. 6. Changes in alveolar macrophage population composition in COPD.
A UMAPs of control and COPD alveolar macrophage cells color labelled by Louvain cluster (left) and disease status (right). B Percent makeup of alveolar macrophage across all nine Louvain clusters per subject, as assessed by single-cell RNA sequencing (scRNAseq) from 14 lungs with advanced COPD and 13 control donor lungs. Boxes represent median and interquartile ranges (IQRs), whiskers are 1.5 × IQR, and dots represent subjects. P = 0.0281(cluster-0) and 0.0231 (cluster-5). C Heatmap of the distribution of z-scores of marker genes for cluster-0 and cluster-5 alveolar macrophages (*P < 0.05, two-sided Wilcoxon rank-sum test with Bonferroni correction). Columns represent expression values from individual cells and are hierarchically ordered by macrophages cluster, disease status, and subject. D Sample immunofluorescence images of MT2A (purple) in CD68+ cells (green) in control and COPD lung tissue samples (arrows). Arrows point to colocalization of MT2A and CD68 (white). Scale bar = 50 µm. Original magnification of cropped image = ×20. Images representative of 5 control and 5 COPD samples. E Quantification of MT2A immunofluorescence staining in CD68 + cells (n = 233 control cells and 277 COPD cells from 5 subjects/group). Each color represents a different patient. Data are presented as median ± interquartile range. P = 1.39 × 10⁻¹³. F Quantification of the percent of MT2Ahigh cells per patient (n = 5/group). Data are presented as median ± interquartile range. P = 0.00794. G Violin plots of THBS1, PELI1, and CDC42 expression in alveolar macrophages in control and COPD subjects. P = 1.57 × 10⁻³¹ (THBS1), 2.63 × 10⁻²⁸ (PELI1), and 5.77 × 10⁻¹³ (CDC42). *P < 0.05, **P < 0.005, ***P < 0.0001 using Wilcoxon rank-sum test adjusted for FDR (B), unadjusted two-sided Wilcoxon rank-sum test (E, F), and two-sided Wilcoxon rank-sum with Bonferroni correction (G).

