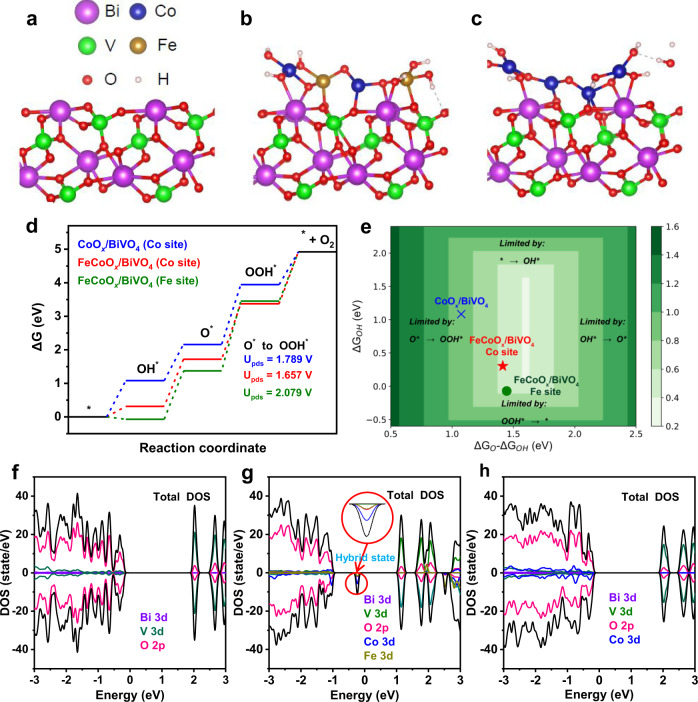
Fig. 4. Theoretical understanding of the promotion effect of the FeCoOx cocatalyst.
Visual representation of structures of BiVO4 {110} surface (a) FeCoOx/BiVO4 {110} interface (b) and CoOx/BiVO4 {110} interface (c) for the DFT calculations. d Free energy diagram for OER process on FeCoOx/BiVO4 and CoOx/BiVO4 {110} interfaces. The surface structures with various reaction intermediates are shown alongside the free energy diagram. Upds, equilibrium potential for the potential determining step. e Theoretical overpotential plot with O∗ and OH∗ binding energies as descriptors. Calculated densities of state for the BiVO4 {110} surface (f), FeCoOx/BiVO4 {110} interface (g), and CoOx/BiVO4 {110} interface (h).

