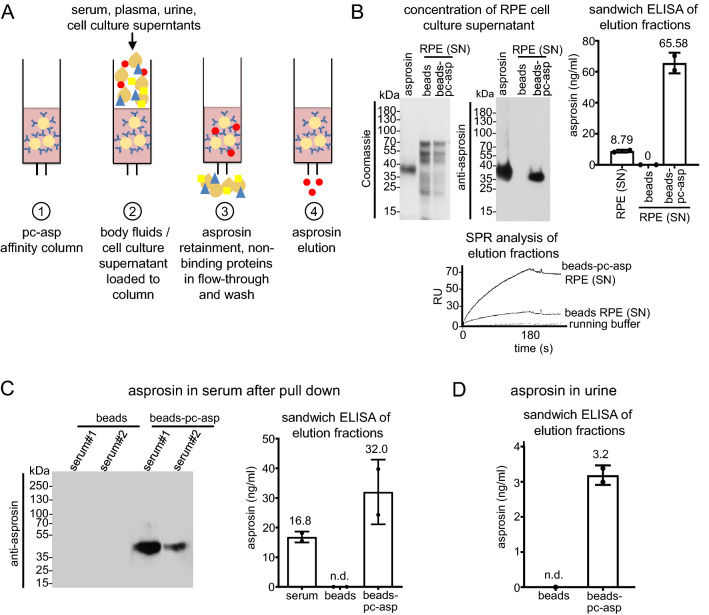
Figure 3.
Affinity column chromatography allows specific asprosin concentration from serum and urine. (A) Schematic diagram showing the pull-down approach using pc-asp antibody for asprosin enrichment in cell culture supernatant and human biological samples. (B) (top left) Coomassie stain of 10% SDS-PAGE gel of recombinantly expressed and affinity-purified asprosin, pull-down from RPE media supernatant with CNBr beads (control), and pc-asp antibody coupled to CNBr beads. (top middle) Western Blot with mab anti-asprosin (1:1000, 1 µg/ml) showing specific bands of the recombinantly expressed asprosin and the endogenous asprosin of the RPE supernatant (1 L serum-free cell culture supernatant) pull-down from pc-asp antibody coupled to CNBr beads. (top right) Detection of asprosin in RPE cell culture media before and after pull-down enrichment showing an eight-fold increase of asprosin concentration by sandwich ELISA. (Bottom) Sensorgram of SPR showing detection of endogenous asprosin in RPE supernatant pull-down from CNBr beads coupled to the pc-asp antibody. Data obtained from two independent pull-down experiments. (C) (left) Western Blot analysis with mab anti-asprosin (1:1000 dilution, 1 µg/ml) of the pull-down from two human serum samples with pc-asp antibody coupled to CNBr beads showing endogenous asprosin band. (right) Quantification of the endogenous asprosin levels using sandwich ELISA in the human serum sample (1 ml serum diluted 1:10 with 10 mM Tris–HCl, pH 7.5) before and after enrichment of asprosin concentration by asprosin pull-down approach. (D) Detection of asprosin in human urine (200 ml) after enrichment using the pull-down approach. Data obtained from urine sample subjected to two independent pull- down experiments. Data were analyzed using Graphpad Prism version 8.0.2.

