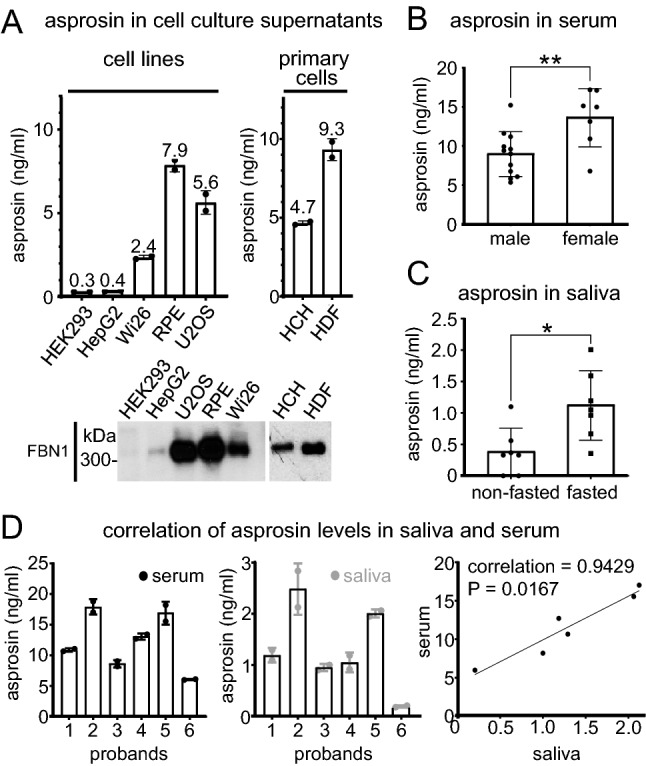
Figure 4.

Asprosin levels in serum and saliva depend on biological sex, fasting, and show a strong correlation. (A) (top left) Endogenous asprosin levels in various human cell lines supernatants and (top right) primary human cells (human dermal fibroblasts and human chondrocytes) were measured using asprosin sandwich ELISA (n = 2 per each group). (bottom) western blot showing the corresponding fibrillin-1 expression in cell lines supernatants. (B) Comparative analysis of asprosin levels in blood serum (25 µl serum fourfold diluted in 75 µl PBS) of male and female groups (n = 19, m/f = 12/7, age = 30.4 ± 6.4 years, weight (W) = 72.9 ± 11.3 kg, height (H) = 1.75 ± 0.08 m, BMI = 23.7 ± 2.9 kg/m2) using sandwich ELISA and analyzed by unpaired two-tailed t-test, **P = 0.0072. (C) Assessment of asprosin levels in saliva (100 µl saliva) in fasting (overnight fasting, 8–9 h) and non-fasting (3 h after lunch) conditions by sandwich ELISA (n = 7, m/f = 3/4, age = 32.3 ± 8.71 years, weight = 70.5 ± 13.8 kg, height = 1.74 ± 0.09 m, BMI = 23.3 ± 3.04 kg/m2) and analyzed by Wilcoxon matched-pairs signed-rank test, *P = 0.0156). (D) (left and middle) Quantification of asprosin levels in human serum and saliva respectively in fasted condition (overnight fasting) by sandwich ELISA (n = 6, m/f = 3/3, age = 32.7 ± 9.09 years, weight = 64.5 ± 8.77 kg, height = 1.71 ± 0.07 m, BMI = 22.1 ± 2.44 kg/m2). (right) Correlation of asprosin levels in human serum and saliva using Spearman correlation = 0.94, *P = 0.02, (n = 2 per each group). Data were analyzed using Graphpad Prism version 8.0.2.
