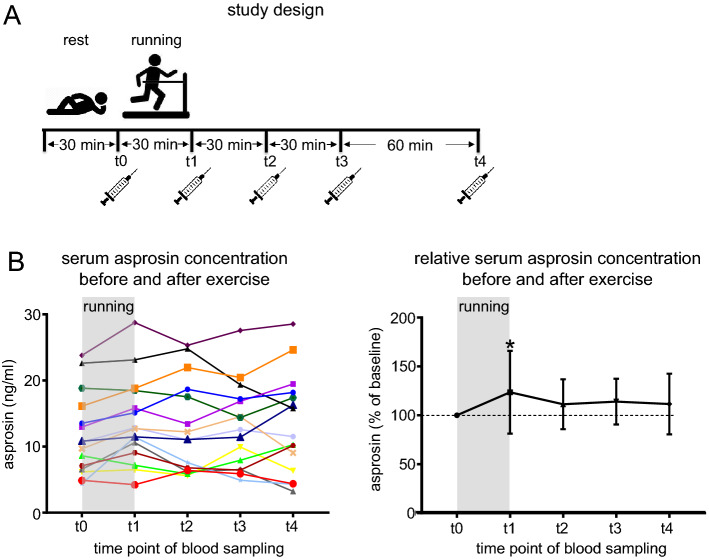
Figure 5.
Asprosin serum levels increase after 30 min of running exercise. (A) Schematic diagram representing the overall study design showing exercise and rest regimens and blood sampling time points. (B) (Left) Absolute serum asprosin concentration (ng/ml) for each subject before and after running exercise (n = 15 subjects); t0: immediately before running exercise (after 30 min rest in sitting position); t1: immediately after exercise; t2, t3, and t4 represent 30 min, 60 min, and 120 min after exercise, respectively. (right) Relative serum asprosin concentration after running exercise (t1, t2, t3, and t4) normalized to its baseline concentration before exercise (t0) and represented as percentage. A significant increase of asprosin concentration was observed immediately after running exercise; asprosin concentration (c) at t0 = 100%; c(asprosin) t1/c(asprosin) t0 = 123.7 ± 42.3%; c(asprosin) t2/c(asprosin) t0 = 111.3 ± 25.5%; c(asprosin) t3/c(asprosin) t0 = 114 ± 23.40%; c(asprosin) t4/c(asprosin) t0 = 111.5 ± 31.06%; *P = 0.0385. Serum (25 µl) fourfold diluted in PBS (75 µl) for asprosin concentration analysis. Data were analyzed using Graphpad Prism version 8.0.2.

