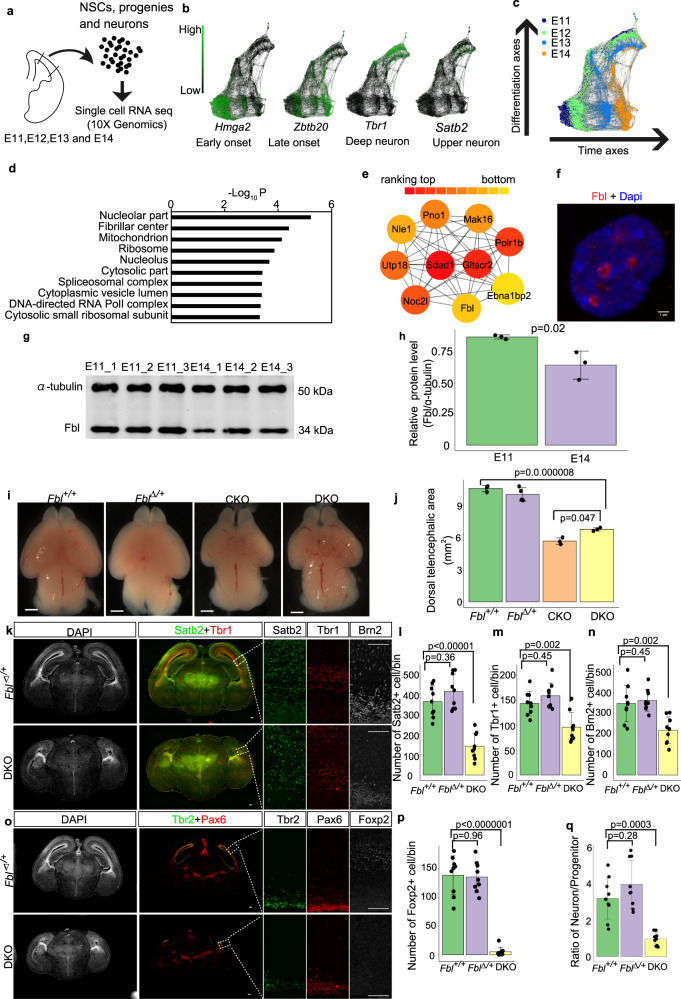
Fig. 1. Fbl is essential for brain development.
a Experiment design for single-cell (sc) RNA-seq. Cell number in scRNA were E11 n = 829, E12 n = 2457, E13 n = 1566, and E14 n = 1293. b, c SPRING graph of single cells colored by different stages (c), and expression patterns of an early-, a late-onset gene, a progenitor, and a neuron marker, respectively. d Gene Ontology (GO) analysis of the gene module (brown module) that showed higher expression in E11 than E14 neural stem cells (NSCs). e Top ten module nodes based on protein interaction networks in the brown module. f E14 NSC stained for Fbl and Dapi showing nucleolar Fbl expression (n = 5). Scale bars, 1 µm. g Western blot of Fbl and ɑ-tubulin using isolated Hes1+ NSCs. h Quantitative analysis of Fbl protein levels showing reduced Fbl at E14 (two-sided Student t test; data are presented as mean ± s.d. of n = 3 experiments). i Whole-mount brain image at E17 showing microcephaly after Fbl knockout. The genotype of mice are: Fbl + /+:Fblflox/+P53−/−;Fbl∆/+:Fblflox/+ P53−/−Emx1Cre/+; Fblflox/+P53 + /−Emx1Cre/+; CKO:Fblflox/floxP53 + /−Emx1Cre/+; DKO:Fblflox/floxP53−/− Emx1Cre/+. Scale bars, 1 mm. j Quantitative analysis of the dorsal telencephalic area in different mice. Data are presented as the mean ± s.d. of n = 3 or 4 brains Statistic analysis was performed by one-way ANOVA followed by Tukey’s post hoc tests. k, o E17 brain sections showing a reduced number of both deep- and upper-neurons in DKO. Scale bars, 100 µm. l–n, p Immunostaining-based cell number quantification (n = 3 mice per genotype, n = 3 sections per mouse). q Ratio of Tbr1+ or Brn2+ neurons and Pax6+ or Tbr2+ progenitors (n = 3 mice per genotype, n = 3 sections per mouse). Data are presented as the mean ± s.d. of n = 9 sections. Statistic analysis was performed by one-way ANOVA followed by Tukey’s post hoc tests. For each section, an area with a length of 200 µm along with an apical membrane was counted. Such region was defined as a bin.

