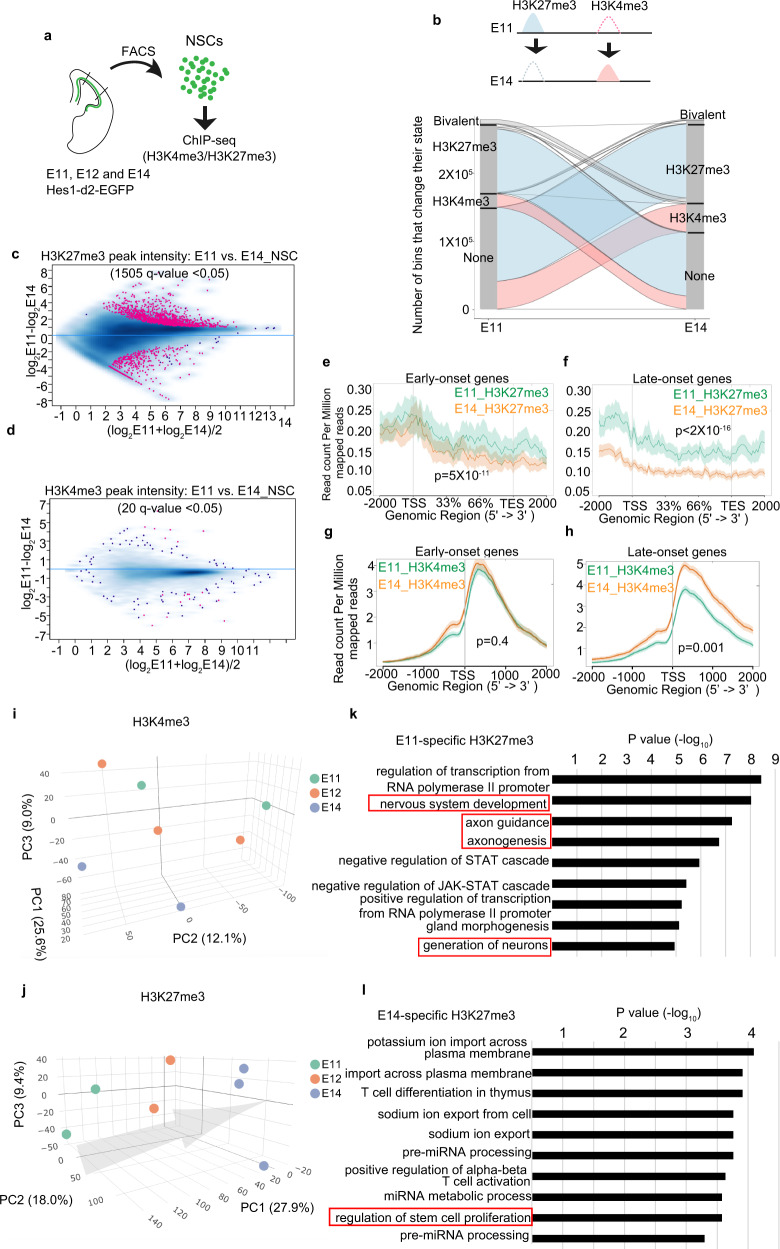
Fig. 6. Genome-wide H3K4me3 and H3K27me3 modification change during temporal patterning of neural stem cells (NSCs).
a Experiment design for chromatin immunoprecipitation and sequencing (ChIP-seq). b H3K27me3 and H3K4me3 change of isolated Hes1+ NSCs from E11 to E14. Lines represent 200-bp chromosome regions. c, d Intensity comparison of H3K27me3 (c) and H3K4me3 (d) peaks between E11 and E14 NSCs, showing that H3K27me3 changed more dramatically than H3K4me3. Peaks with q-value < 0.05 are shown in red. e–h Read-density profiling of H3K27m3 (e, f) and H3K4m3 (g, h) at early-onset (e, g) and late-onset genes (f, h) in wild-type E11 and E14 NSCs. A two-sided Wilcoxon signed-rank test was used to evaluate the difference between E11 and E14 NSCs. The shaded areas represent standard errors. i, j Principal component analysis (PCA) of H3K27me3 and H3K4me3 peaks showing H3K27me3 samples can represent developmental time. Arrow indicates temporal axes. Different colored dots represent different stages of samples. k, l Top ten GO term of genes, with which stage-specific H3K27me3 peaks are associated.

