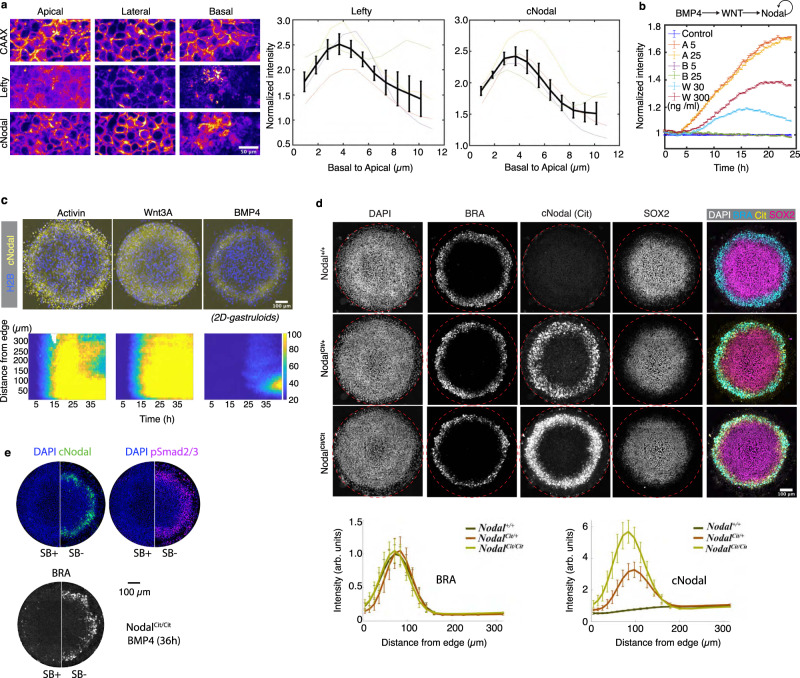
Fig. 1. Visualization of a fully functional endogenous Nodal protein in hESCs and 2D-gastruloids.
a Immunostaining of cNodal (anti-GFP antibody) and Lefty (anti-Lefty) in Activin treated Nodalcit/cit cells with mCherry-CAAX membrane marker. Both cNodal and Lefty showed the highest levels at the basolateral side (normalized to mCherry-CAAX). Data are presented as mean values + /− SEM, n = 4 biological replicates. Scale bar 50 µm. b Quantification of cNodal expression in response to addition of Activin (5, 25 ng/ml), Wnt3A (30, 300 ng/ml), or BMP4 (5, 25 ng/ml). Normalized mean intensity of cNodal from time-lapse imaging over 24 h with a 20-minute interval is quantified. Data are presented as mean values + /− SEM, n = 5 biological replicates. c Activin, Wnt3A, or BMP4 treated micropatterned cNodal hESCs with CFP-H2B nuclear marker. (bottom) Mean intensity of cNodal from time-lapse imaging over 43 h with 30-minute interval is quantified as function of time and distance from colony edge. d (left) Representative images of 2D-gastruloids with the indicated genotypes are shown. (right) Quantification of BRA and cNodal levels in 2D-gastruloids with the indicated genotypes after 40 h of BMP4 treatment. Data are presented as mean values + /− SEM, n = 10 independent colonies. Mean intensity and standard error across colonies are plotted as a function of distance from colony edge. Colonies for imaging were chosen based on visualization of DAPI without visualizing the other channels. Brachyury (BRA) represents mesodermal fate. SOX2 represents ectodermal fate. Cit represents anti-mCitrine (GFP antibody). e SB-431542 an ALK4/5/7 inhibitor was used to inhibit Nodal signaling in homozygous cells and the expression of cNodal, pSmad2/3 and BRA were compared (representative of n = 6 colonies for each condition). Scale bar, 100 µm. Maximum intensity projection images are shown in all figures.

