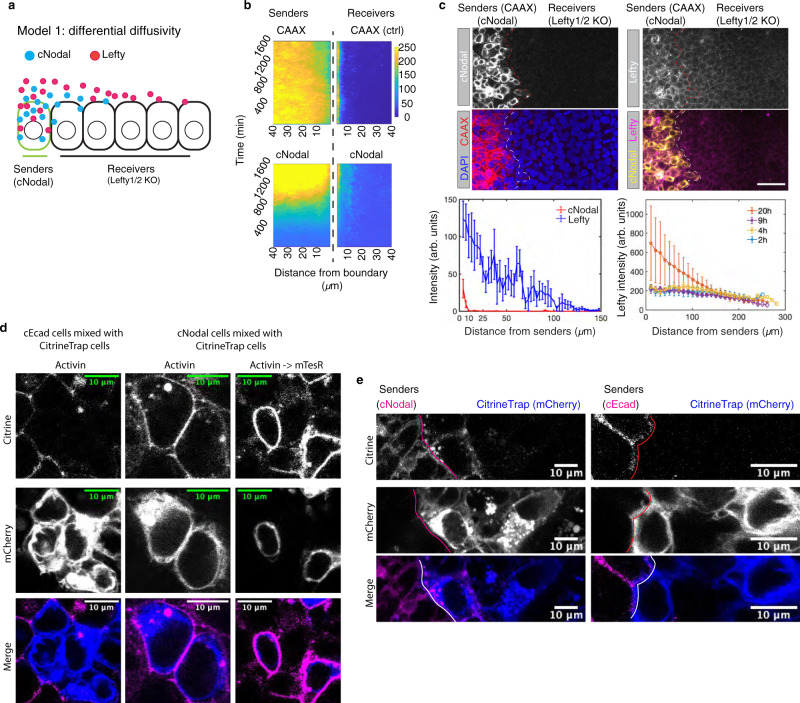
Fig. 2. Nodal only reaches cells that touch producing cells.
a Schematic of protein differential diffusivity model. Senders (green outline) represent cells that produce cNodal (solid blue circles) and Lefty1/2 (solid magenta circles) upon Activin induction. Receivers represent Lefty1/2 KO cells that cannot make either Lefty or cNodal proteins. b, c Experimental test of the differential diffusivity model. Sender cells are labeled by cell membrane localized mCherry-CAAX. b Live-cell imaging over 27 h with a 20-minute interval. mCherry-CAAX and cNodal levels in senders or receivers are quantified as function of distance from border. mCherry-CAAX in senders is used as a non-diffusive control. c Anti-GFP that recognizes mCitrine and anti-Lefty antibodies (Supplementary Fig. 5) were used to measure protein ranges. Quantitative analysis of staining images is shown. Mean intensity of cNodal (anti-GFP) and Lefty at 20 h (bottom left) or of Lefty at 2, 4, 9, 20 h (bottom right) is quantified as a function of distance from border (n = 4). Scale bar, 100 µm. Images are 20 h post juxtaposition. Data are presented as mean values + /− SEM, n = 4 biological replicates. d Representative cells from a larger field of coculture of (left) E-Cadherin-mCitrine (cEcad) or (middle and right) cNodal cells with CitrineTrap cells. The middle panel only shows two CitrineTrap cells, right panel shows two CitrineTrap cells (blue) and surrounding cNodal cells. Scale bar, 10 µm. Similar results were observed in more than 3 repeated experiments. e Representative cells of juxtaposition experiments with induced cNodal cells or cEcad cells as senders and CitrineTrap cells as receivers. Experiments were repeated independently 3 times with similar results. Scale bar, 10 µm.

