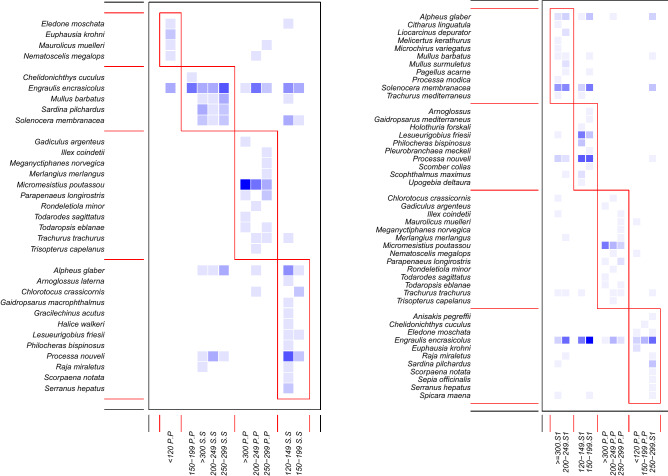
Figure 4.
Heat map showing modules (aggregated sets of interacting species) detected in the bipartite weighted graphs by applying Newman’s modularity measure. Shading of matrix entries indicates number of observations (darker shades describe a higher number of observations). On the left modules identified in 2016 samples (inside Pomo, P; shelf outside S), on the right modules identified by using samples collected within the Pomo Pit in 2016 (P) and outside the Pomo Pit in 2014 (depicted as S1, Riccioni et al., 2018). Modules are identified in red. Analysis performed by using the R package bipartite75 and R environment77.

