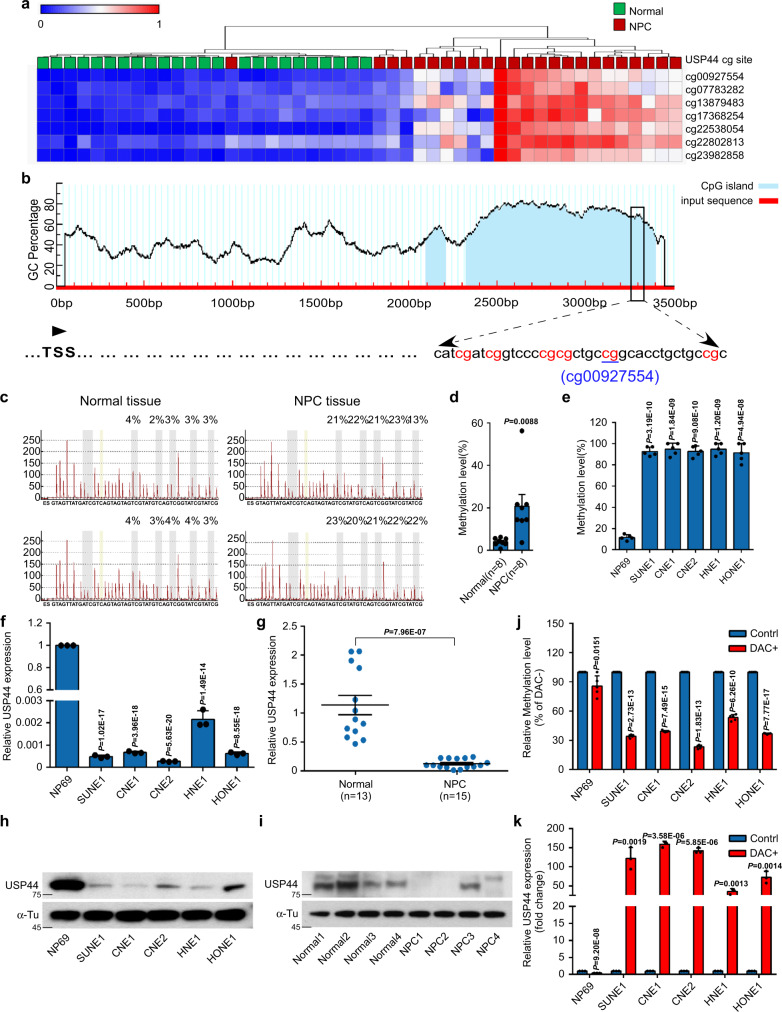
Fig. 1. Promoter hypermethylation of USP44 downregulates its expression in NPC.
a Heatmap clustering of seven hypermethylated CpG sites in the CpG islands of USP44 in normal nasopharyngeal epithelial tissues (n = 24) and NPC tissues (n = 24). Columns: individual samples; rows: CpG sites; blue: low methylation; red: high methylation. b Schematic illustration of the bisulfite pyrosequencing region in the USP44 promoter. Red region: input sequence; blue region: CpG islands; TSS: transcription start site; red text: CG sites used for bisulfite pyrosequencing; blue text: the most significantly altered CG site in the USP44 promoter. c, d Bisulfite pyrosequencing analysis of the USP44 promoter region (c) and statistical analysis of methylation levels (d) in normal (n = 8) and NPC (n = 8) tissues. e The methylation levels of the USP44 promoter region between NP69 and NPC cell lines (SUNE1, CNE1, CNE2, HNE1, and HONE1) were determined through bisulfite pyrosequencing analysis. f, g RT-PCR analysis of relative USP44 mRNA expression in the NP69 cell line and NPC cell lines (f) and in normal (n = 13) and NPC (n = 15) tissues (g). h, i Representative western blot analysis of USP44 protein expression in NP69 cells and NPC cell lines (h), together with normal and NPC tissues (i). j, k USP44 methylation levels measured by bisulfite pyrosequencing analysis (j) and relative USP44 mRNA levels measured by RT-PCR analysis (k) in NP69 cells and NPC cell lines with (DAC+) or without (DAC−) DAC treatment. Data in d and g are presented as the mean ± SEM, and those in e, f, j, and k are presented as the mean ± SD; the P values were determined using the two-tailed Student’s t-test; n = 3 independent experiments. Source data are provided as a Source Data file.

