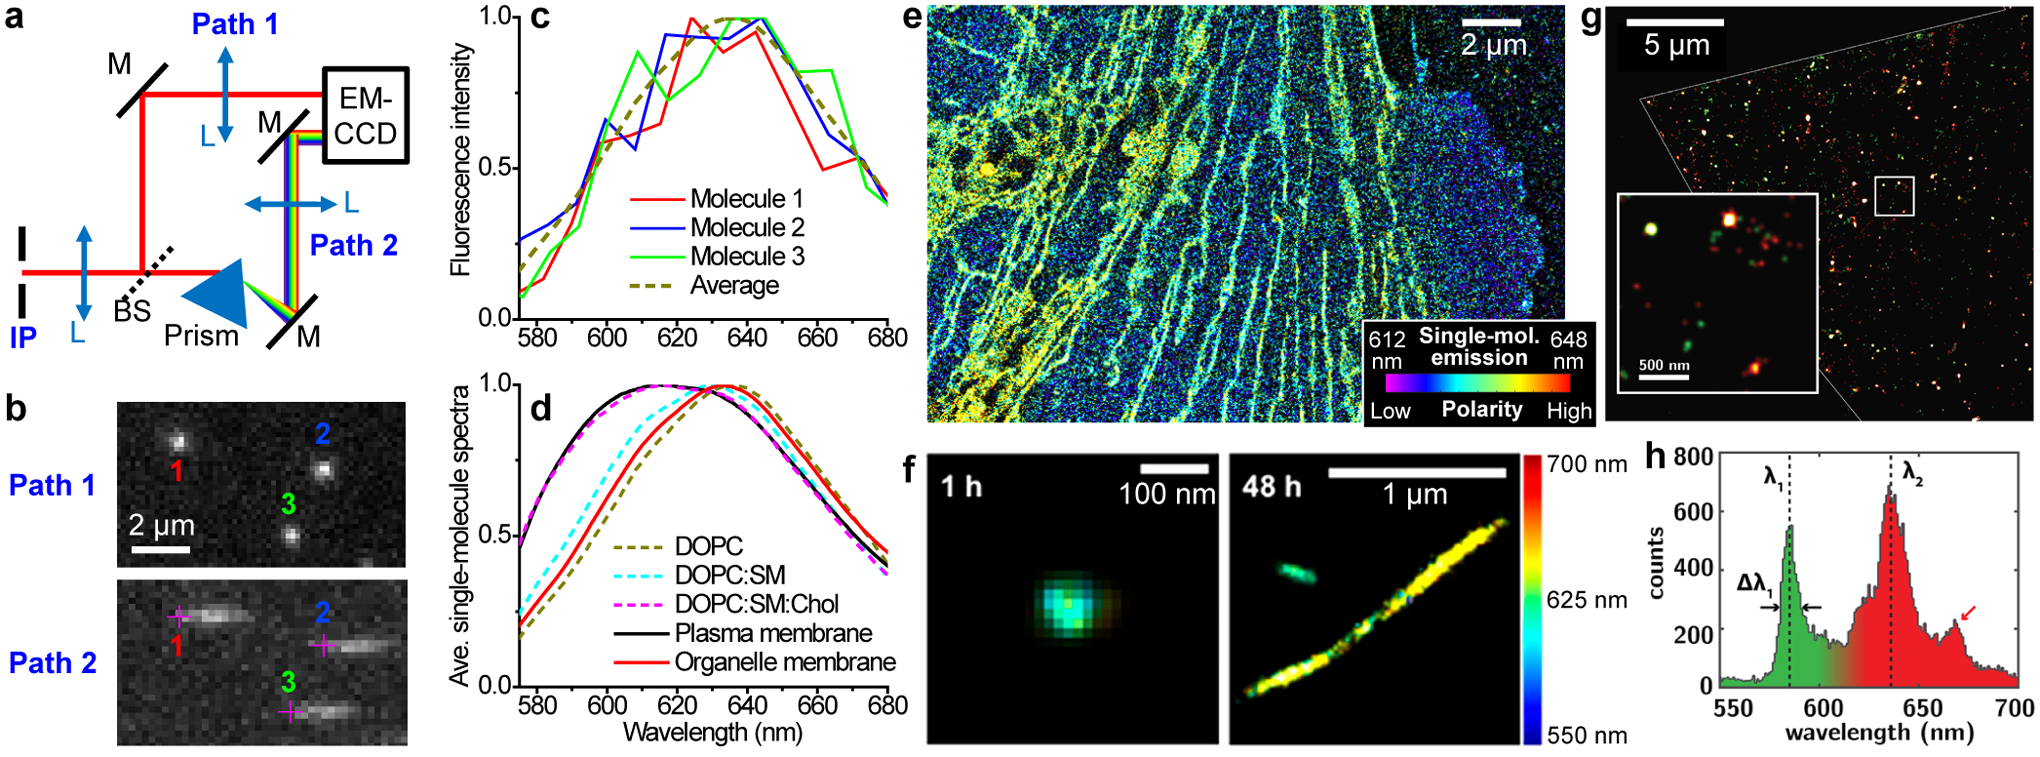
Figure 3.

Spectrally resolved SMLM unveils nanoscale heterogeneities in biological and materials systems. (a) Schematic of a beamsplitter-based system. IP, intermediate image plane of the microscope; BS, beamsplitter. (b) A small region of single-molecule images (top) and spectra (bottom) concurrently acquired in a 6 ms snapshot from Paths 1 and 2 in (a), respectively, for Nile Red molecules in a supported lipid bilayer (SLB). Crosses in the spectral channel denote the spectral position of 590 nm for each molecule, as obtained by referring to the positions of the same molecules in the image channel. (c) Spectra of the three molecules in (b), compared to that averaged from 280,898 single molecules from the same sample. (d) Averaged spectra of single Nile Red molecules at the live-cell plasma membrane and at the nanoscale organelle membranes, versus that at SLBs of different compositions. (e) SR-SMLM image of a Nile Red-labeled live PtK2 cell. Color presents single-molecule spectral mean. (f) SR-SMLM image of Nile Red-labeled α-synuclein aggregates after 1 h (left) and 48 h (right) incubation. (g) SR-SMLM image of fluorescent defects in a flake of hexagonal boron nitride, colored by emission wavelength. (h) Distribution of center emission wavelengths for individual defects in (g). (a–e) are from ref70. (f) is from ref72. (g,h) is from ref66.
