Figure 4.

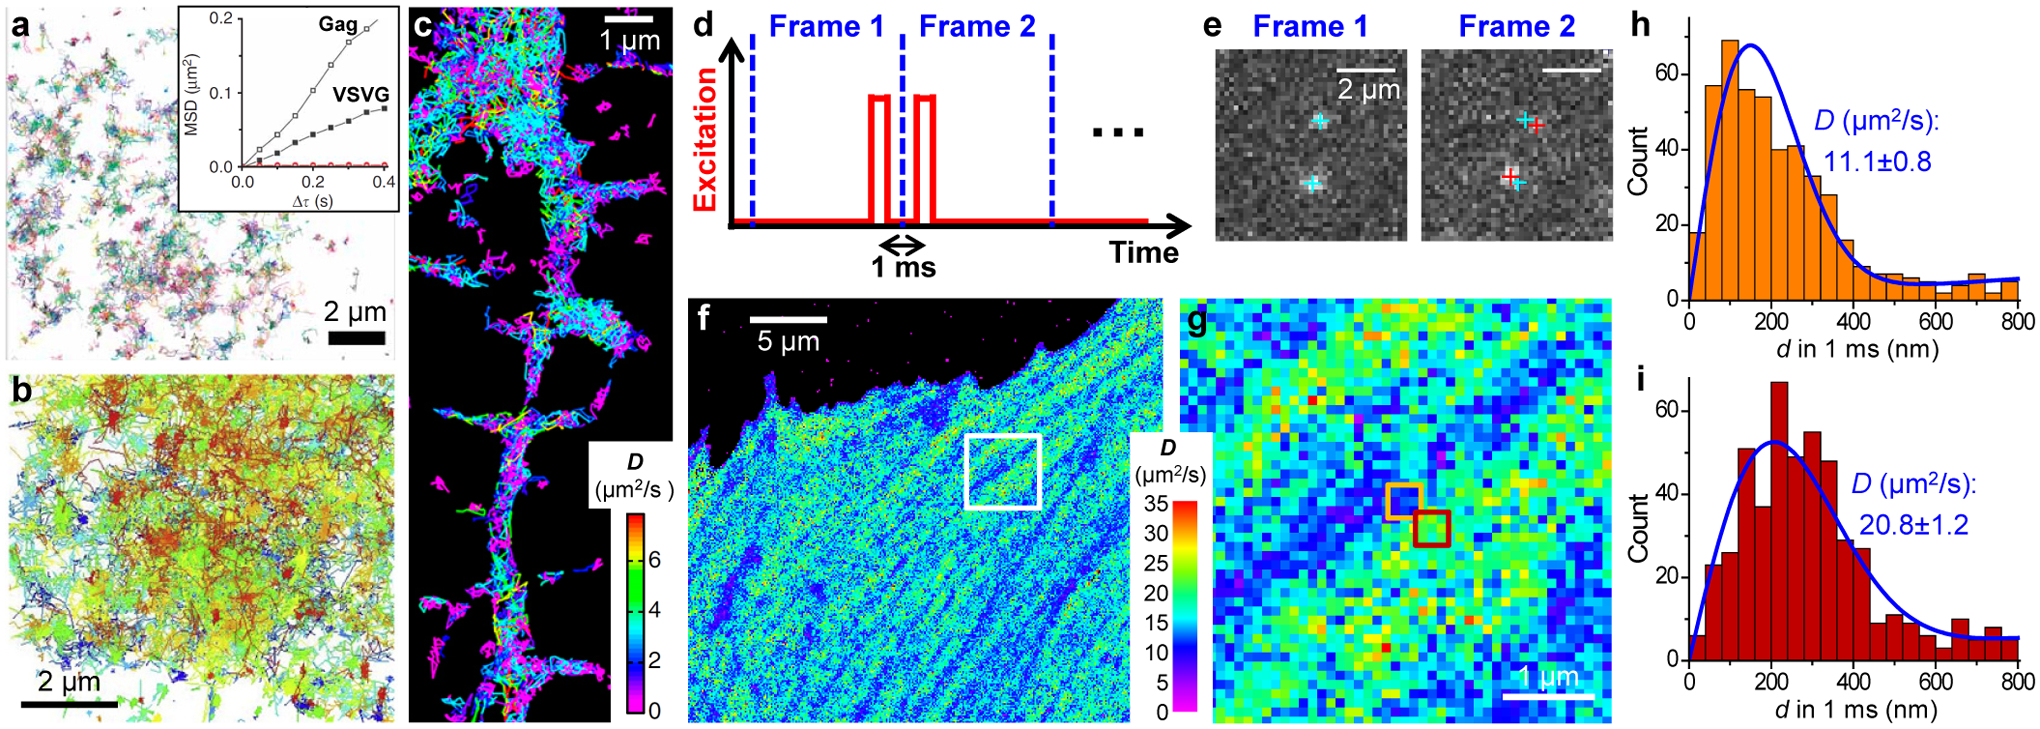
From single-molecule motion to nanoscale diffusivity mapping. (a) High-density single-molecule tracking in a live COS-7 cell via photoactivation of the Eos FP tagged to the membrane protein VSVG. Each color indicates a different single-molecule trajectory. Inset: mean-squared displacement as a function of time lag for two trajectories of Gag and VSVG. (b) High-density single-molecule tracking of GPI-GFP in the plasma membrane of a live COS-7 cell through the in situ binding of anti-GFP-AT647Ns. (c) High-density single-molecule tracking of the lipophilic dye DiI in the plasma membrane of a live neuron. Color presents the fitted diffusion coefficients D for each molecule. (d) Detecting the transient displacements of single molecules by applying a pair of closely timed stroboscopic excitation pulses across two tandem camera frames. (e) Resultant images recorded in the two frames for two mEos3.2 FP molecules freely diffusing inside a living cell. Cyan and red crosses: positions of the two molecules in Frame 1 and Frame 2, respectively. (f) SMdM D map obtained from ~104 pairs of the above excitation pulses by binning the resultant single-molecule displacements onto 100×100 nm2 grids for local fitting to a diffusion model. (g) Zoom-in of the white box in (f). (h,i) Distribution of 1-ms single-molecule displacements for two adjacent 300 × 300-nm2 areas [orange and red boxes in (g)]. Blue curves: fits with resultant D values and uncertainties labeled. (a) is from ref78. (b) is from ref81. (c) is from ref79. (d–i) are from ref87.
