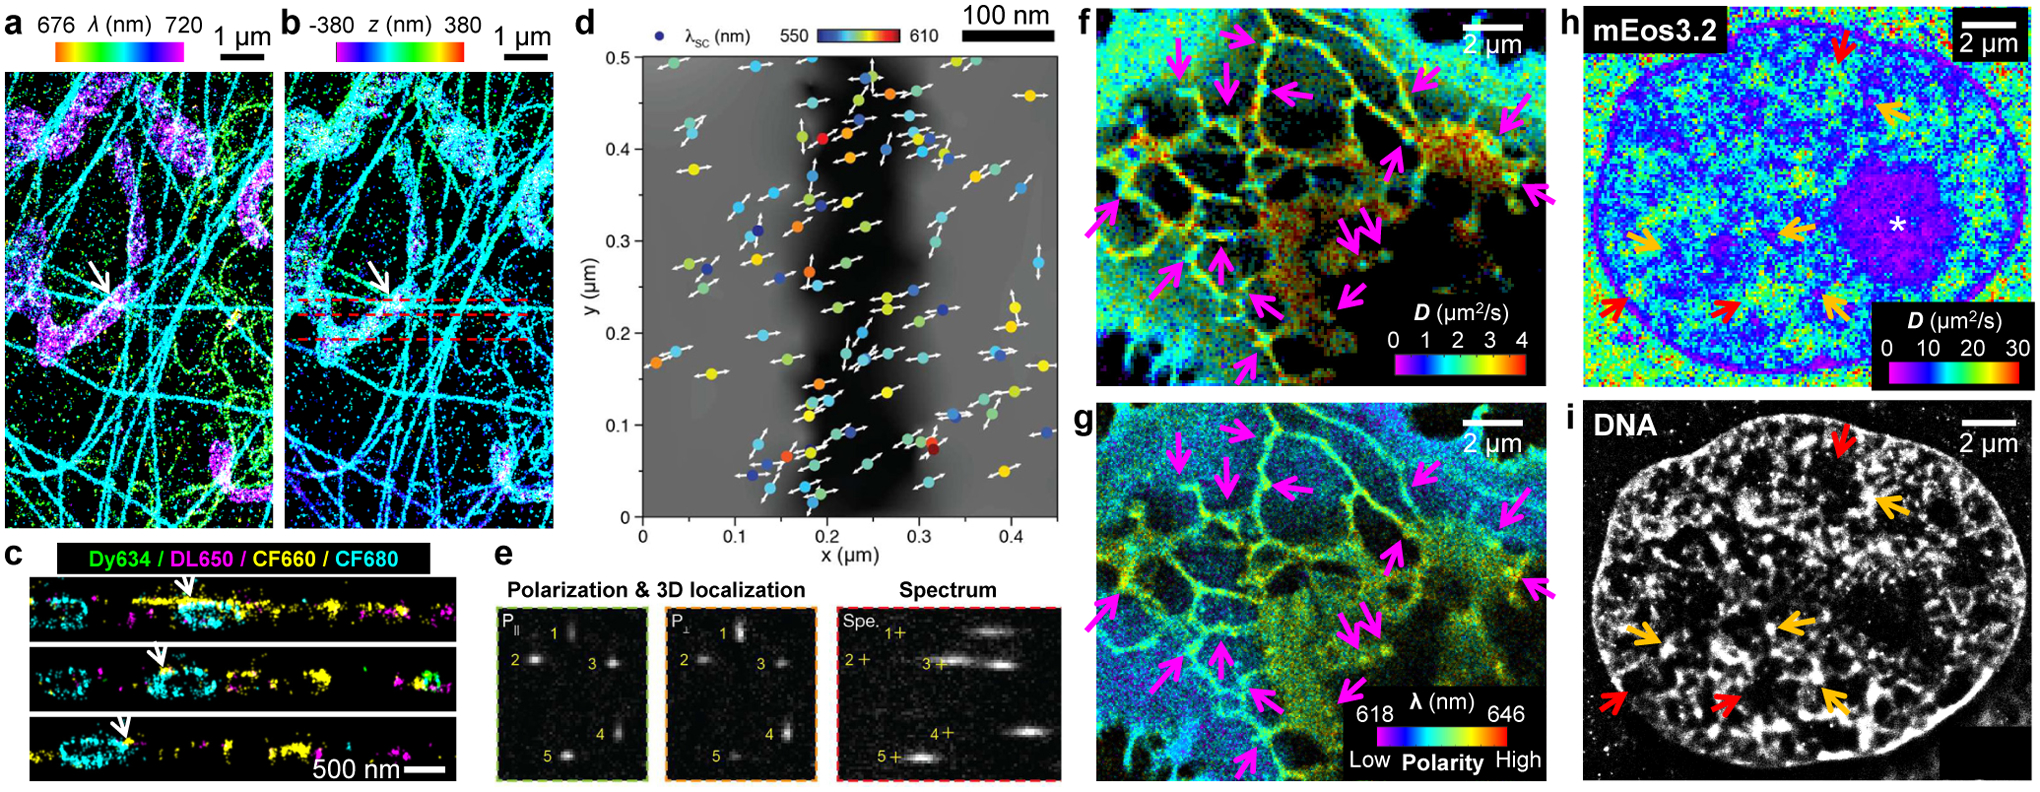
Figure 5.

Integration and combination of multidimensional single-molecule signals. (a,b) Integration of SR-SMLM (a; color for emission wavelength) and 3D-SMLM (b; color for axial depth z) for a fixed cell labeled by four spectrally overlapped dyes. (c) Vertical sections along the three dashed lines in (b). Here each molecule is categorized as one of the four dyes and accordingly recolored. (d) Concurrent detections of orientation (arrows) and emission wavelength (color) for single quantum rods in the wide field. (e) Three complementary views are obtained for single quantum rods: two for polarization directions plus 3D localizations (left two panels) and one for spectra in the wide field (right). (f,g) Concurrent SMdM (f; color for diffusivity D) and SR-SMLM (g; color for emission wavelength) for Nile Red in cellular membranes, showing reduced D but unchanged emission wavelength at endoplasmic reticulum-plasma membrane contact sites (arrows). (h,i) Correlated SMdM (colored for D) of the mEos3.2 FP in the nucleus of a mammalian cell (h) and SMLM of the same cell with a DNA stain (i). Asterisk: reduced D in the nucleolus. Red and orange arrows: highest and lowest D in the SMdM image, coinciding with regions devoid of DNA and of high local DNA density in the SMLM image, respectively. (a–c) are from ref57. (d,e) are from ref90. (f,g) are from ref88. (h,i) are from ref87.
