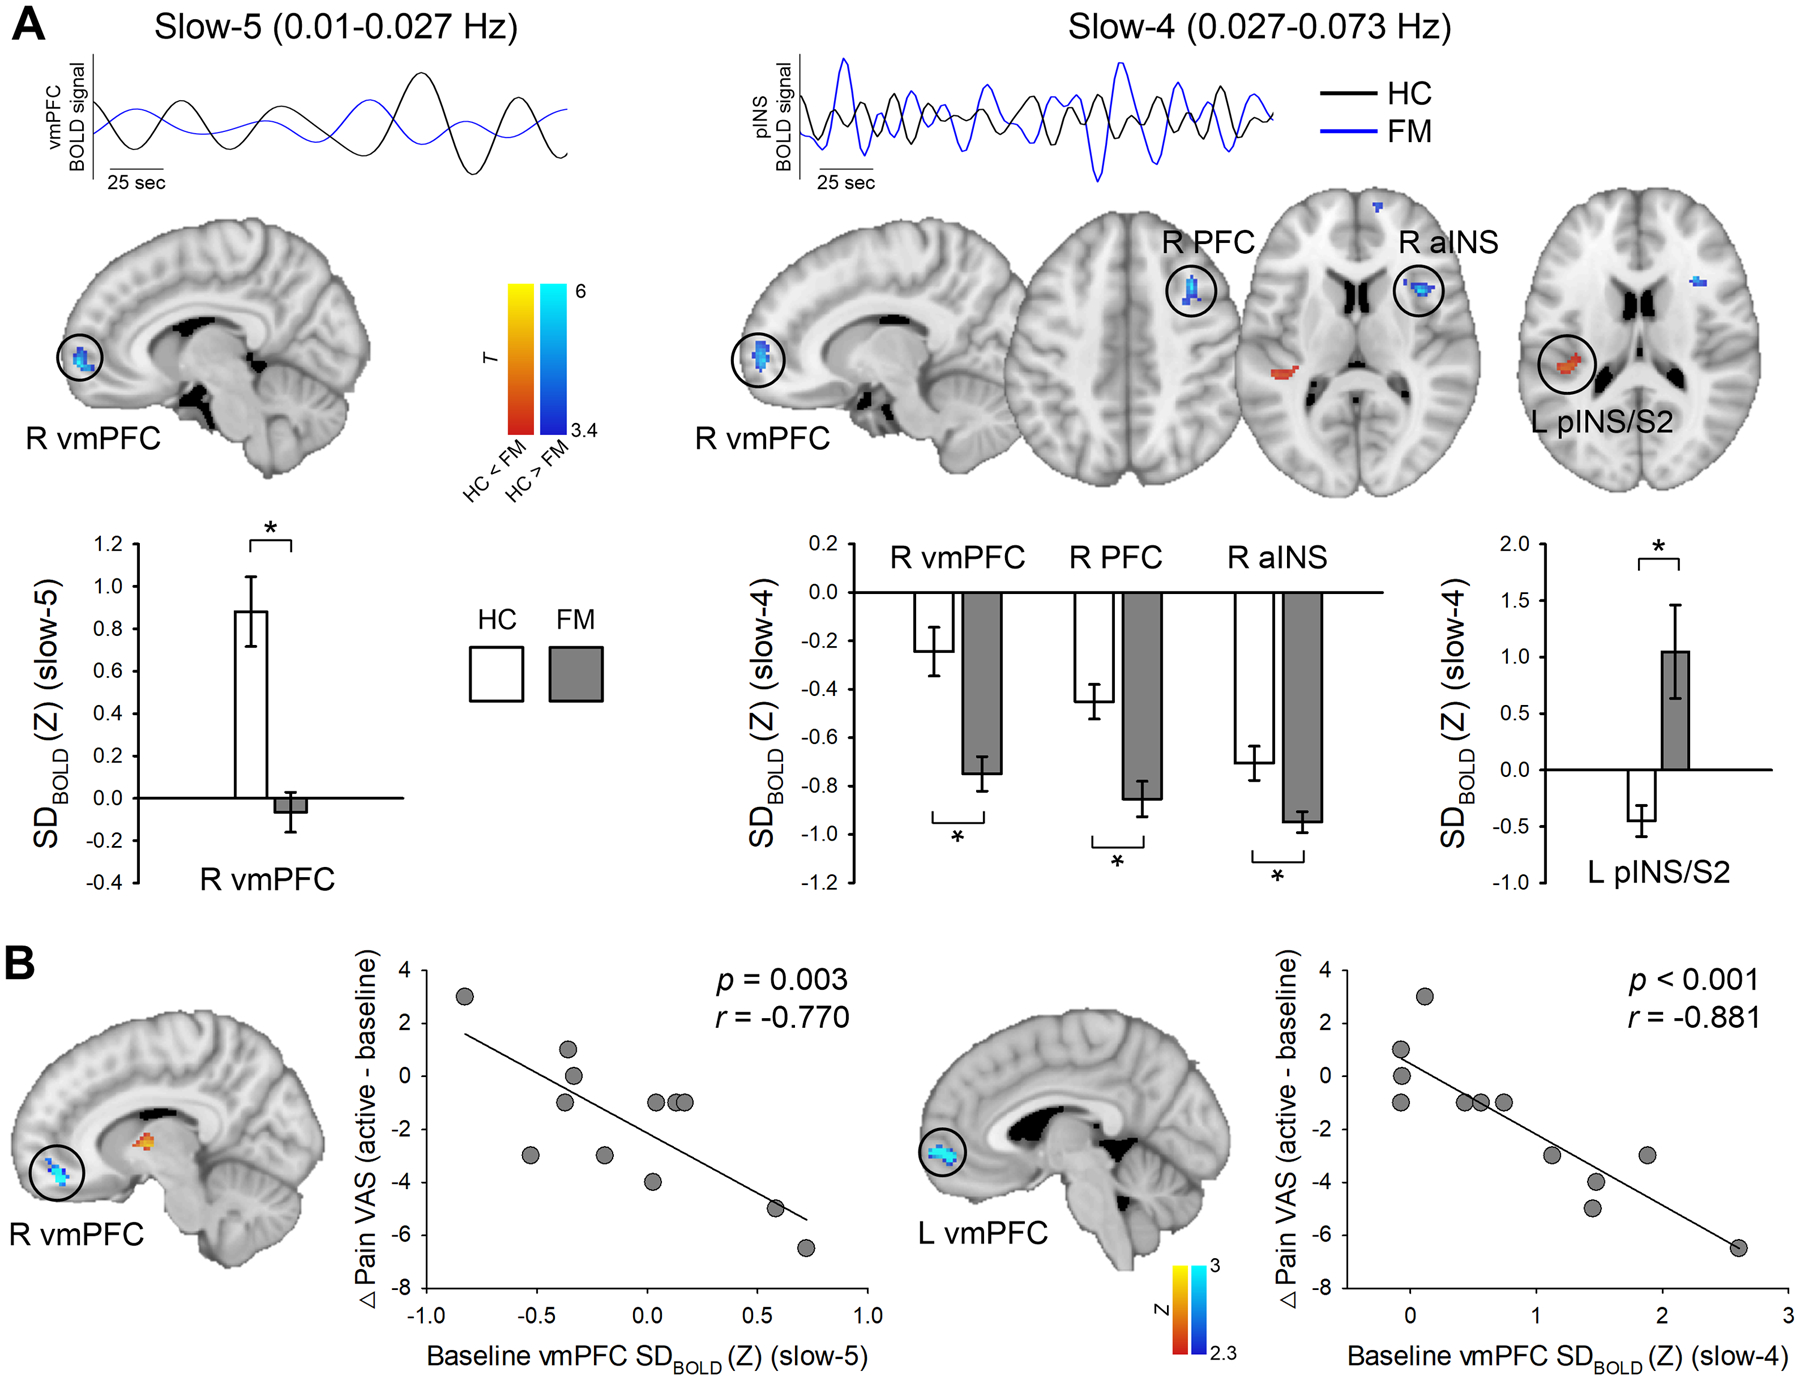
Fig. 1. Regional abnormalities of baseline (pre-treatment) BOLD signal variability (SDBOLD) in fibromyalgia (FM) compared to healthy controls (HC).

(A) Baseline group differences of resting-state SDBOLD in the slow-5 (0.01 – 0.027 Hz) and slow-4 (0.027 – 0.073 Hz) frequency bands. Blue (FM) and black lines (HC) indicate the representative time-course of band-pass filtered BOLD signal in each slow frequency band. Brain regions displaying increased (hot scale bar) and decreased (cool scale bar) SDBOLD in FM patients compared with HC were overlaid on the MNI standard brain. All statistical images are displayed with significant clusters (voxel-level threshold p < 0.001 and cluster-level extent threshold p < 0.025, FWE-corrected*). Grey bars represent FM patients (n = 12), white bars represent HC subjects (n = 15). Bar graphs were expressed as mean ± standard error of the mean. (B) Correlation between baseline SDBOLD (slow-5 and slow-4) in the ventromedial prefrontal cortex (vmPFC) and changes in VAS pain score between active-tDCS and baseline. Higher SDBOLD of the vmPFC at baseline predicted a greater reduction in clinical pain. VAS, visual analog scale; aINS, anterior insula; pINS, posterior insula; S2, secondary somatosensory cortex.
