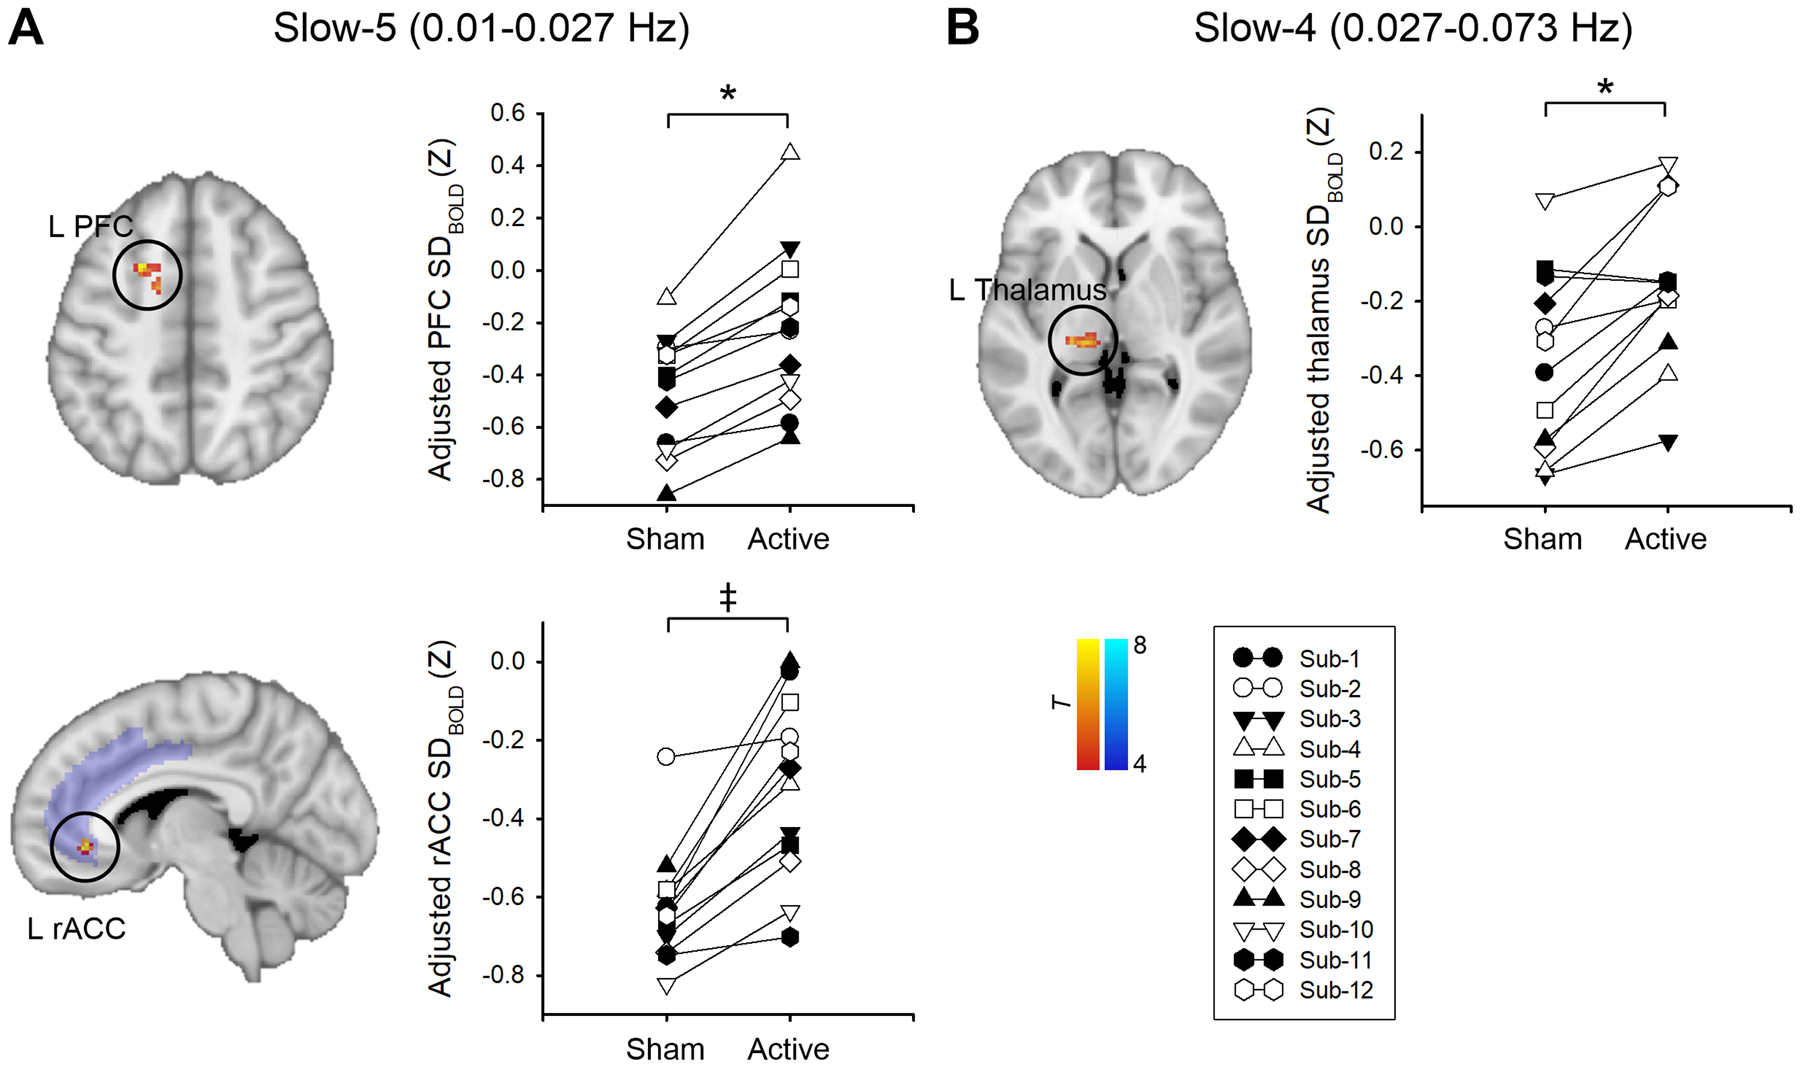
Fig. 2. Changes in BOLD signal variability (SDBOLD) in the slow-5 (0.01 – 0.027 Hz) (A) and slow-4 (0.027 – 0.078 Hz) (B) frequency bands after active tDCS compared with sham tDCS.

All statistical images are displayed with significant clusters (voxel-level threshold p < 0.001 and cluster-level extent threshold p < 0.025, FWE-corrected*) except for the left rostral anterior cingulate cortex (rACC). Area of interest (ACC) was probed using small volume correction in the predefined cingulate mask. The cingulate mask (purple) was derived from the Harvard-Oxford cortical structural atlases. The significance threshold was set to voxel-level p < 0.001 (uncorrected), combined with a cluster-extent threshold of p < 0.025 (FWE-small volume corrected‡). SDBOLD was adjusted (mean + residual) for age and mean frame-wise displacement. Each symbol represents an individual fibromyalgia patient. PFC, prefrontal cortex; M1, primary motor cortex.
