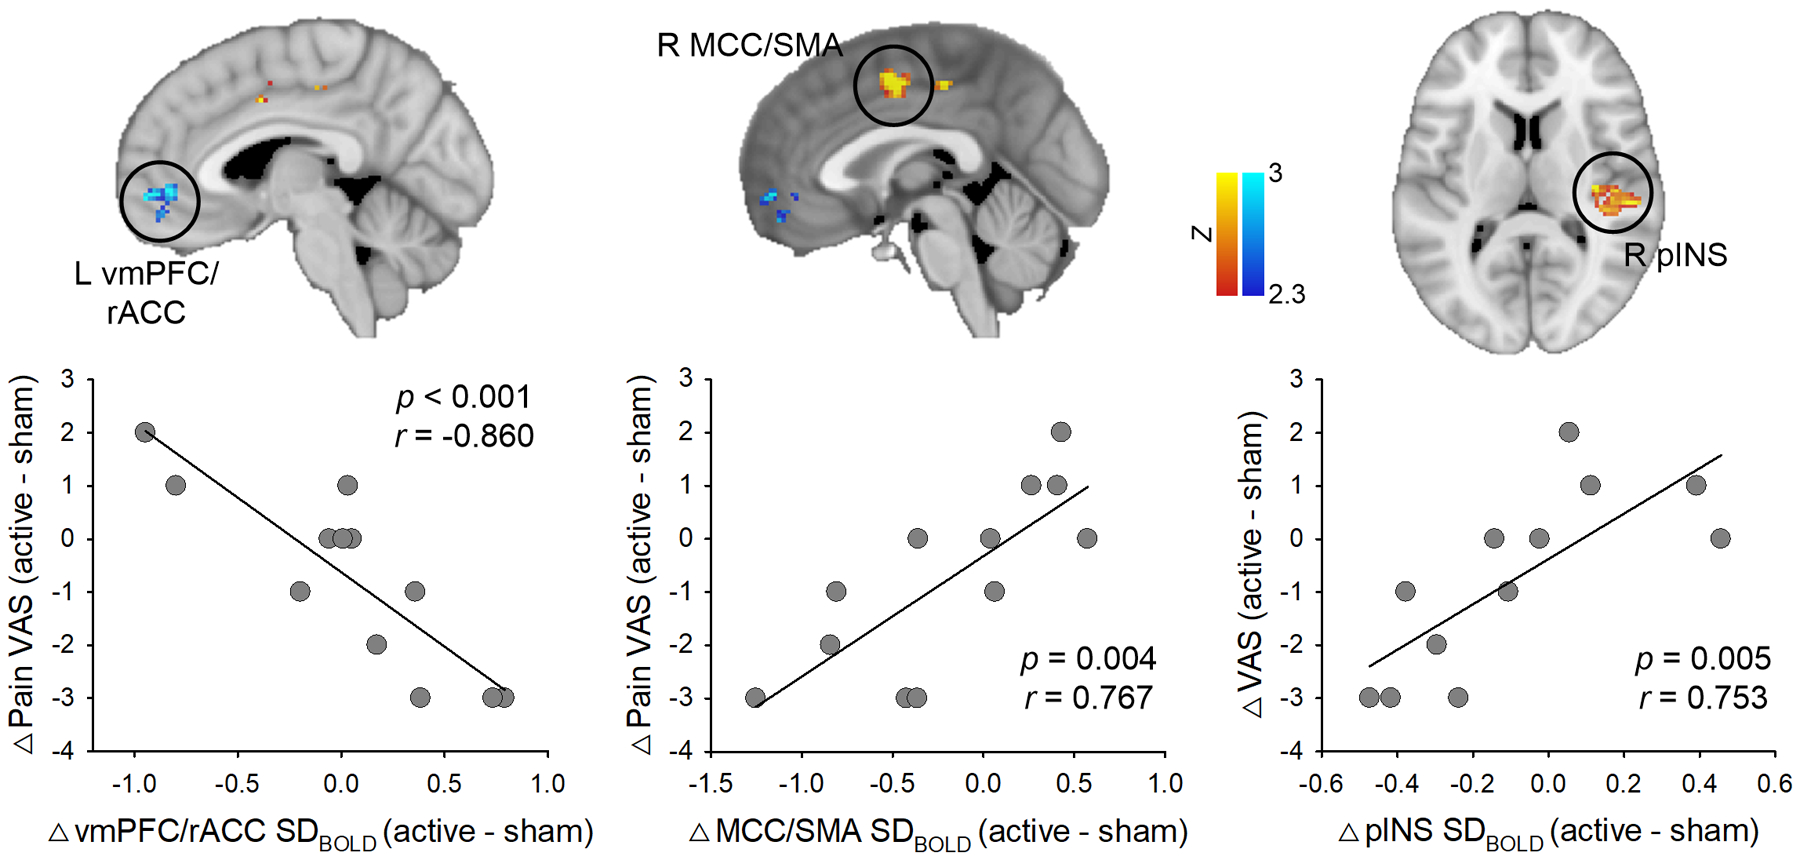
Fig. 4. Correlation between changes in BOLD signal variability (0.01 – 0.027 Hz, slow-5 band) and changes in VAS pain score after active tDCS compared with sham.

Patients with increased SDBOLD in the vmPFC/rACC had a greater reduction in clinical pain. In contrast, patients with decreased SDBOLD in the MCC/SMA or pINS had a greater reduction in clinical pain after active tDCS compared with sham tDCS. Statistical images are displayed with significant clusters (voxel-level threshold Z > 2.3 and cluster-level extent threshold p < 0.025, FWE-corrected). VAS, visual analog scale; vmPFC, ventromedial prefrontal cortex; rACC, rostral anterior cingulate cortex; MCC, midcingulate cortex; SMA, supplementary motor area; pINS, posterior insula.
