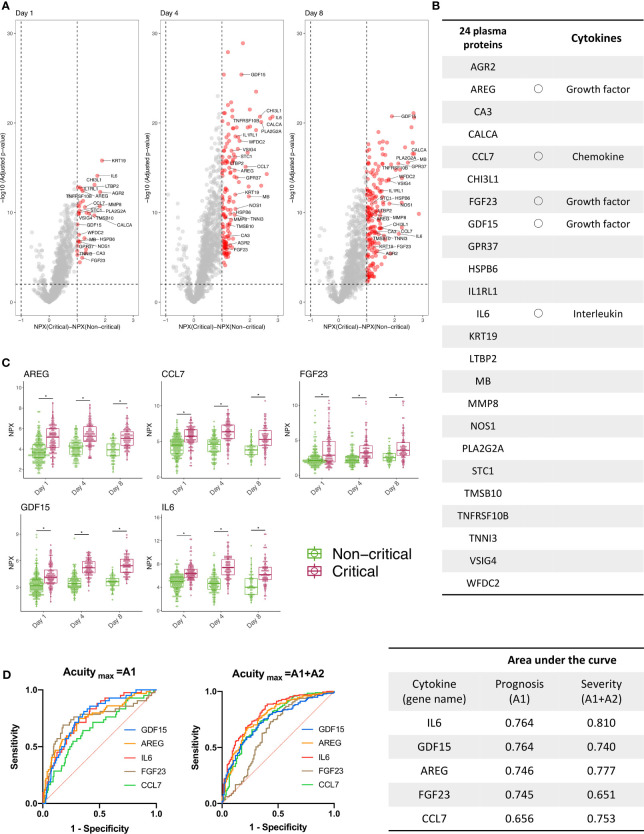
Figure 2.
Three cytokines were derived using public proteomics data provided by the MGH COVID-19 cohort. (A) The volcano plot shows the proteins increased (red) or decreased (blue) in patients with critical COVID-19 (Acuitymax = A1, A2) versus patients with non-critical COVID-19 (Acuitymax = A3, A4, A5) at days 1 (day of admission), 4, and 7 in the MGH derivation cohort. The X-axis shows the differences in NPX, and the Y-axis represents -log10 (adjusted P-values). (B) Twenty-four proteins were classified as significantly increased and were the proteins that showed differences of NPX >2 and -log10 (adjusted P-values) >2 from day 1 to day 8. Five of the 24 proteins (gene names: AREG, CCL7, FGF23, GDF15, IL6) were classified as cytokines. (C) Longitudinal change of the five cytokines. The COVID-19 individuals were further classified into two groups, “Non-critical “and “Critical”, on days 1, 4, and 8. The NPX values are plotted on the Y axes. In all box plots, the boxes show the median and upper and lower quartiles, and the whiskers show 5th to 95th percentiles. The difference between two groups was measured by Wilcoxon rank-sum test (*P < 0.05). (D) The NPXs of 5 cytokines on day 1 were used for an ROC curve analysis, and the AUC was calculated to evaluate the severity and prognostic accuracy of each marker. For the following cytokines with gene names IL6, AREG, and GDF15, the AUCs of both prognosis (Acuitymax = A1) and disease severity (Acuitymax = A1, A2) were >0.7. WHO ordinal outcomes scale: A1, died; A2, intubated, survived; A3, hospitalized on oxygen; A4, hospitalized without oxygen; A5, discharged). MGH, Massachusetts General Hospital; COVID-19, coronavirus disease 2019; NPX, normalized protein expression value; ROC, receiver operating characteristic; AUC, area under the curve; IL, interleukin; GDF, growth differentiation factor; WHO, World Health Organization.

