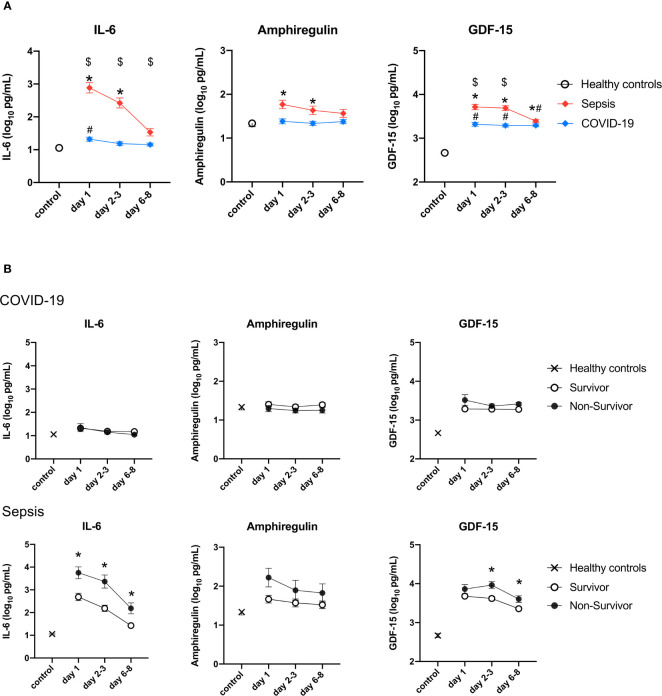
Figure 3.
Change in the levels of three cytokines in the validation cohort. The cytokines were transformed to common logarithm values to normalize the data distribution. All data are expressed as the mean ± SE. (A) Asterisks indicate a statistically significant difference between control and septic patients (there were significant differences in the three cytokines), # indicates a statistically significant difference between control and with patients COVID-19 on each day (P <0.05), $ indicates a statistically significant difference between patients with sepsis and patients with COVID-19. (B) The cytokine levels in survivors and non-survivors on each day in patients with sepsis and patients with COVID-19. Asterisks indicate a statistically significant difference between survivors and non-survivors (P < 0.05) on each day. SE, standard error; COVID-19, coronavirus disease 2019; IL, interleukin; GDF, growth differentiation factor.

