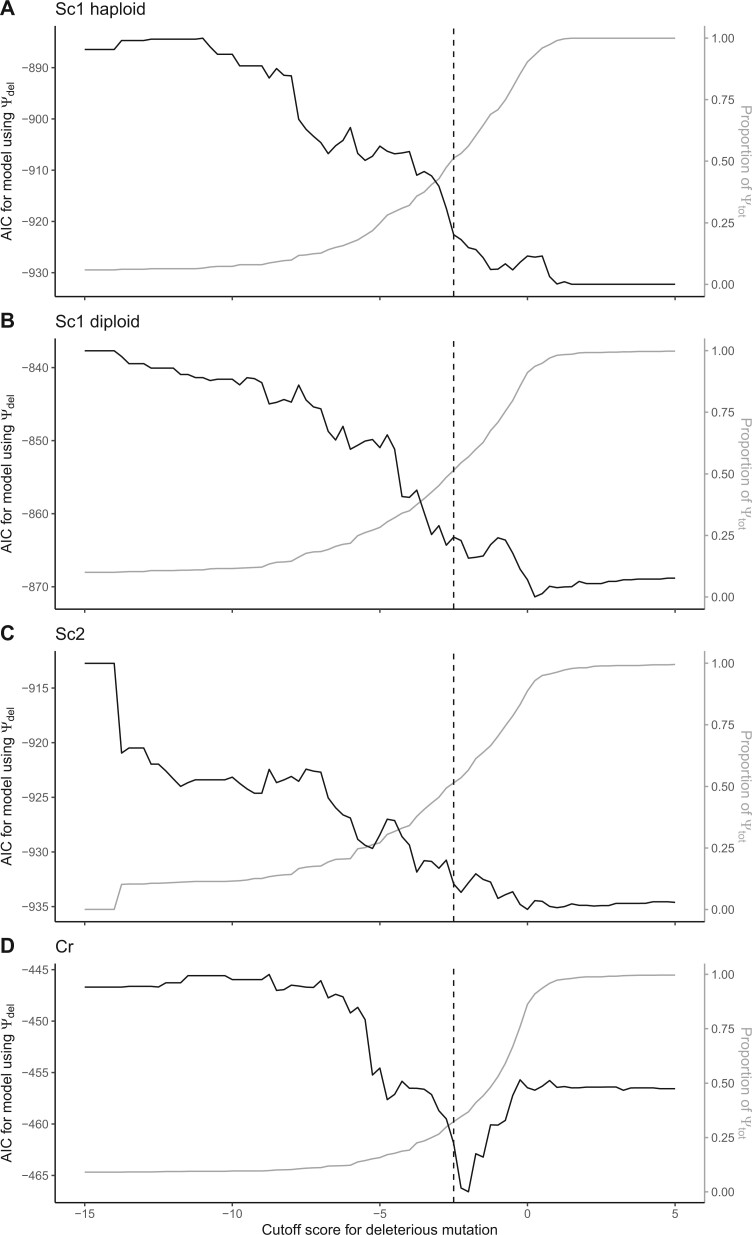
Fig. 3.
Varying the threshold for what to call deleterious mutations. The black line shows AIC score (on the left axis), and the gray line shows the proportion of mutant proteins that is considered deleterious (the right axis). In yeast (A, B, C), the best model uses all mutations, that is, the AIC score of the model using Ψdel as the explanatory variable decreases the closer Ψdel gets to Ψtot. In Cr, a cutoff of approximately −2 gives Ψdel the biggest ΔAIC compared with the model using all protein mutants.

