Figure 7.
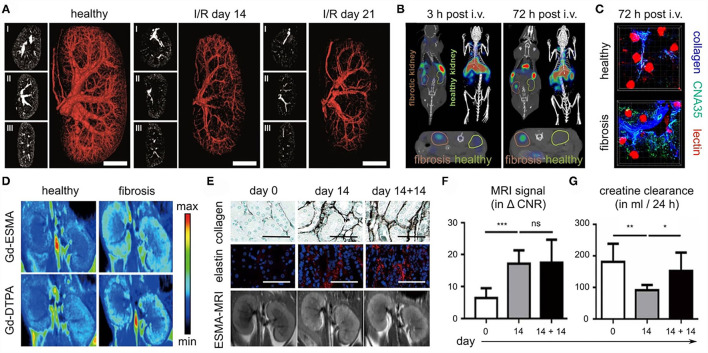
Imaging kidney fibrosis. (A) 2D and 3D images reconstructed from contrast-enhanced micro-CT imaging show progressive vessel rarefaction in mice with I/R-induced kidney fibrosis. Scale bar: 200 μm. (B) Molecular imaging of collagen deposition in the kidneys of mice with I/R-induced fibrosis, employing CNA35 and CT-FMT. (C) Validation of CNA35 binding to perivascular collagen fibers in mice with I/R-induced kidney fibrosis. Perfused blood vessels are stained with lectin. (D) ESMA-enhanced molecular MR imaging of elastin deposition in the kidneys of mice with adenine diet-induced fibrosis. (E–G) In the adenine reversal model (14 days on adenine diet, then 14 days recovery), ESMA-based molecular MRI can detect residual fibrosis that is not detected by routine kidney function assessment, i.e. analysis of creatinine clearance. Scale bar in (E): 50 μm. Images reproduced, with permission, from (57–59). For assessing statistical significance, as shown in (F) and (G), one-way analysis of variance (ANOVA) followed by Bonferroni correction was used. Statistical significance was defined as *p < 0.05; **p < 0.01; ***p < 0.001.

