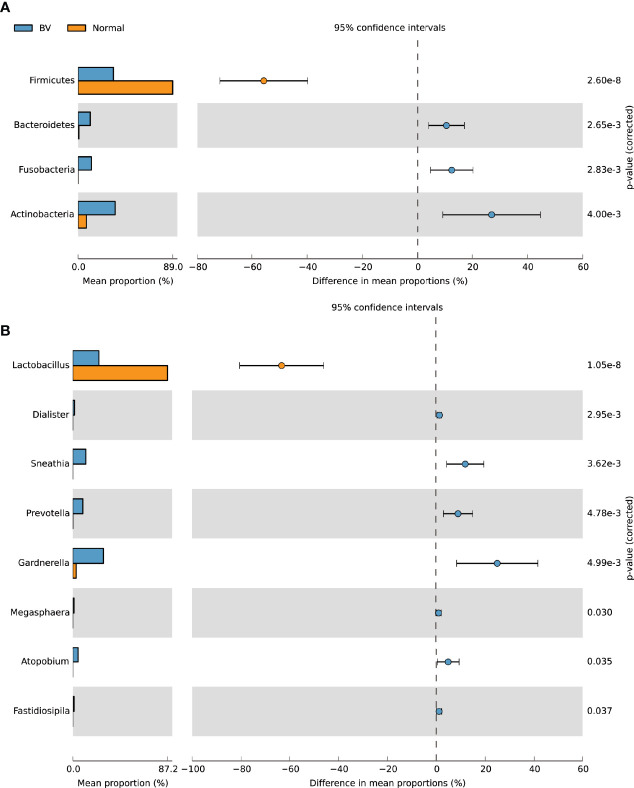
Figure 2.
Relative abundance of bacteria at the (A) phylum and (B) genus level in the normal and BV groups as computed by Welch’s t-test using STAMP software. The middle shows the difference between proportions of abundance in the 95% confidence interval, and the value at the right is the P-value. P < 0.05 represents the significant difference between the two groups.

