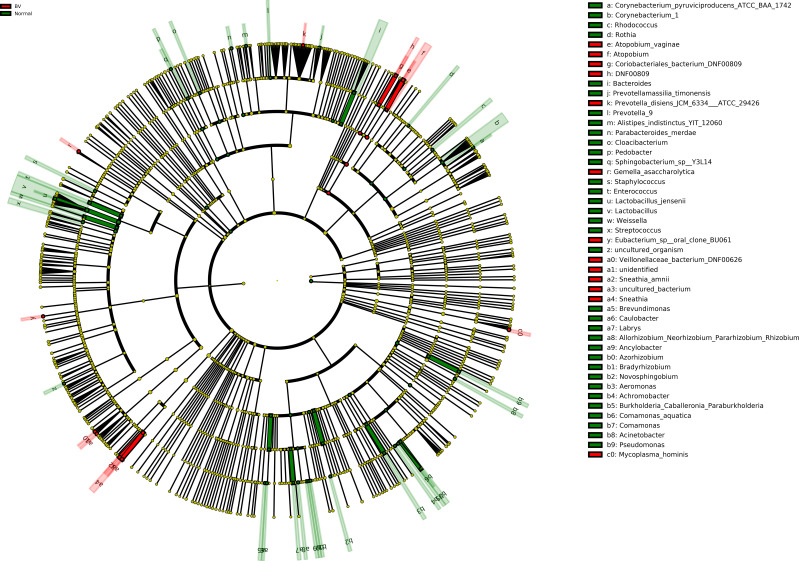
Figure 4.
Cladogram representation of differentially abundant bacterial families detected using LEfSe. The cladogram diagram shows the microbial species with significant differences in the two groups. Red and green, indicate BV and normal microbiota groups respectively, with the species classification at the level of phylum, class, order, family, and genus shown from the outside to the inside. The red and green nodes in the phylogenetic tree represent microbial species that play an important role in the BV and normal microbiota groups, respectively. Yellow nodes represent species with no significant difference. Significantly abundant bacterial groups observed in the study are shown in the list on the right hand side.

