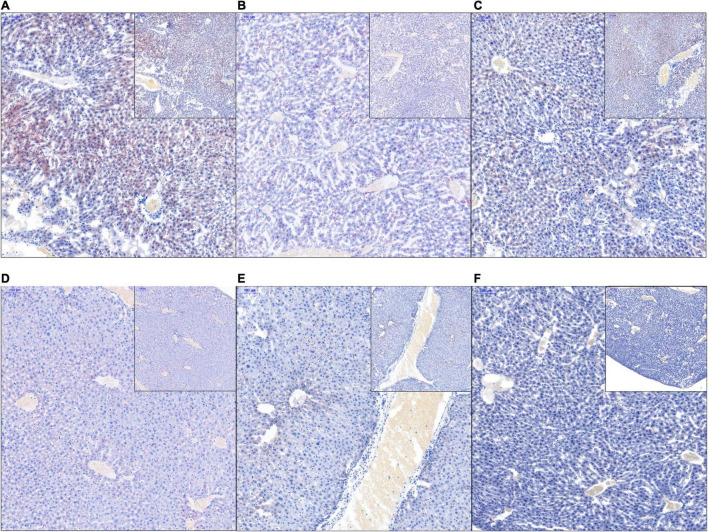
FIGURE 3.
Liver pathological tissue section stained with hematoxylin and eosin and oil red. Red stain indicates adipocytes. (A) HFD; (B) HFDABT; (C) HFDBBR; (D) HFDABTBBR; (E) NCD; (F) NCDBBR. HFD, high fat diet group; HFDBBR, HFD supplemented with berberine; HFDABT, HFD supplemented with antibiotics (by drinking freely); HFDABTBBR, HFD supplemented with berberine and antibiotics; NCD, normal chow diet; and NCDBBR, NCD supplemented with berberine. The upper-right of each histologic photo is a histologic photo with a larger scale.

