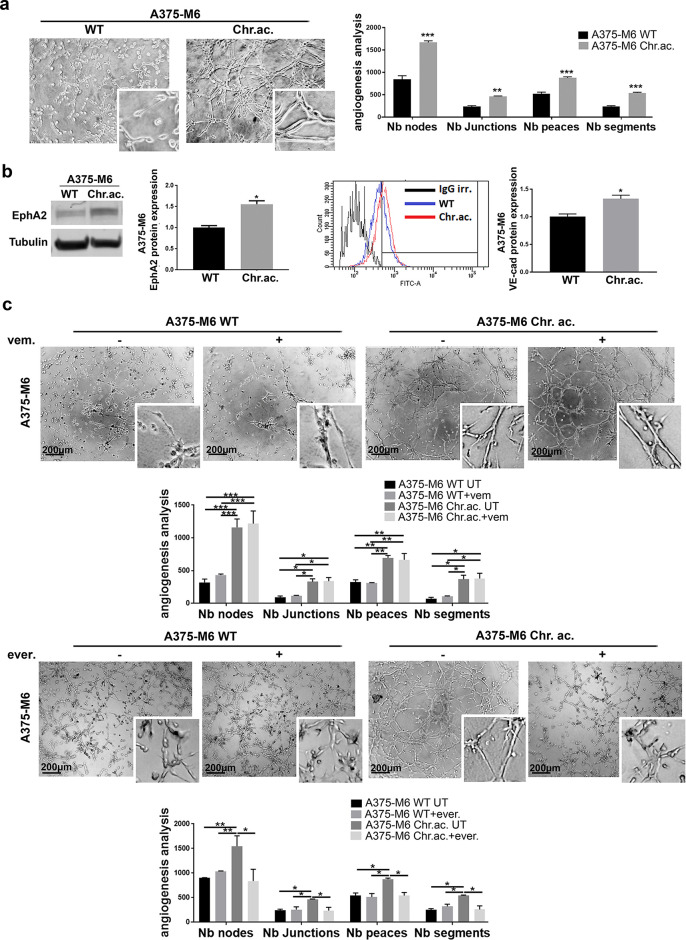
Figure 1.
Extracellular acidosis induces VM in melanoma cells. (a) Representative pictures and relative quantification chart of capillary morphogenesis assay of A375-M6 wild type (WT) or chronically exposed to extracellular acidosis (chr.ac.). Two-way analysis of variance (ANOVA), GraphPad Prism. (b) Western blot (left) and flow cytometer analysis (right) with relative quantification charts of VM markers EphA2 and VE-cadherin of A375-M6 WT or chronically exposed to extracellular acidosis (chr.ac.). t-test, GraphPad Prism. (c) Representative pictures and relative quantification chart of capillary morphogenesis assay of A375-M6 WT or acid-adapted treated or not with 2 μM vemurafenib or 10 μM everolimus for 24 h. Two-way ANOVA, GraphPad Prism. Scale bar: 200 μm. *p < 0.05, **p < 0.01, ***p < 0.001.

