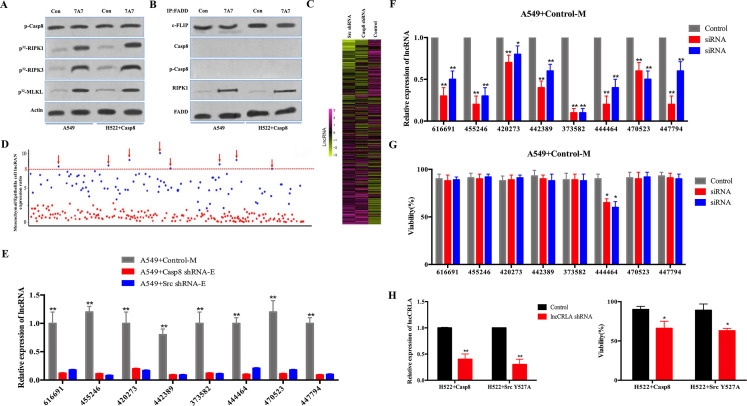
Figure 5.
lncRNA-related chemotherapy resistance in lung adenocarcinoma (lncCRLA) inhibited RIPK1-induced necroptosis in the mesenchymal-like lung adenocarcinoma. (A) Immunoblotting analysis of p-Casp-8 and β-actin in the A549 cells and H522 cells with caspase 8 treated by 200 nM paclitaxel with or without 747 antibody for 48 h after 48-h attachment on the fibronectin-coated dish. Cells were labeled with [32P]-orthophosphate. Phosphorylated RIPK1, RIPK3, and MLKL were measured by Cyclone Plus Phosphor Imager. (B) The immunocomplexes of A549 cells and H522 cells with caspase 8 treated by 200 nM paclitaxel for 48 h after 48-h attachment on the fibronectin-coated dish were eluted with antibody against FADD, and whole elution was used to measure c-FLIP, caspase 8, p-Casp8, and RIPK1. (C) lncRNA microarray data of the mesenchymal-like (A549 + control) and the epithelial-like (A549 + c-Src/caspase 8 shRNA) cells were presented in a heatmap. (D) Most differently expressed lncRNAs between mesenchymal-like (A549 + control) and epithelial-like (A549 + c-Src/caspase 8 shRNA) cells based on lncRNA microarray, >8-fold. (E) Verification of indicated lncRNAs in the mesenchymal-like (M) or epithelial-like (E) A549 cells by quantitative reverse transcription polymerase chain reaction (qRT-PCR) (n = 3). (F) Verification of interference efficiency of siRNAs for indicated lncRNAs in A549 cells with control shRNA by qRT-PCR (n = 3). (G) A549 cells with control shRNA transfected with indicated siRNAs were treated with 200 nM paclitaxel for 48 h after 48-h attachment on the fibronectin-coated dish. Cell viability was determined by measuring ATP levels using Cell Titer-Glo kit. Data were represented as mean ± standard deviation of duplicates. *p< 0.05 versus control. (H) qRT-PCR analysis of lncCRLA in H522 cells with c-Src Y527F/caspase 8 stably transfected with control or lncCRLA shRNA (left). Tumor cells as indicated were treated with 200 nM paclitaxel for 48 h. Cell viability was determined by measuring ATP levels using Cell Titer-Glo kit (right). Data were represented as mean ± standard deviation of duplicates. * p < 0.05 versus control. **p < 0.01 versus control.

